



Oil Builds a War Risk Premium as Saudi Infrastructure Comes Under Fire
Oil is adding a war risk premium this Friday. The threat of renewed strikes on Iran and widening attacks on Saudi infrastructure are now meeting a tight physical market, and Brent settled at $113.17 on Thursday, its highest close since May 4.
Brent: Escalation Risk Returns
The New York Times reported that the US and Israel have drawn up plans for renewed strikes on Iran after the November 3 midterm elections. Closer to the oilfields, Saudi Aramco told staff to evacuate its Dhahran headquarters as fighting with the Houthis intensified, Reuters reported. Middle East exports are running above pre-war levels, yet that has not been enough to calm the market. PVM Oil’s Tamas Varga said reports of higher exports are more than countered by attacks on ships in the Strait of Hormuz and Houthi strikes on Saudi Arabia’s oil infrastructure.
The supply problems are not limited to the Gulf. In Libya, a valve was shut on the pipeline linking the Hamada and Tahara oilfields to Zawiya port, cutting production at both fields, the head of the National Oil Corporation said.
WTI: Domestic Stocks Keep Falling
At home, the cushion keeps thinning. US commercial crude inventories fell 3.1mn barrels to 412.5mn in the week ended October 16, the EIA said, far more than the 820,000-barrel draw analysts expected in a Reuters poll. It was the third straight weekly decline and leaves stocks about 3% below the five-year average. That is why dips in WTI toward $98 keep finding buyers.
Natural Gas: Lean Builds Meet a Warm Forecast
Natural gas tells the opposite story. The EIA reported a 77 Bcf injection for the week ended October 16, lifting working gas to 3,644 Bcf. That is 152 Bcf below a year ago but 35 Bcf above the five-year average. According to NGI, it was the tenth straight injection below historical norms. The South Central region also remains below its five-year average, and LNG feedgas has held above 20 Bcf/d. In a colder autumn, that mix would support prices. Instead, forecasts for unusually mild weather into early November keep heating demand low, and for now the weather is winning.
Natural Gas Price Forecast
Every new Natural Gas analysis as it publishes, today's technical signal and key levels, live price — on one page.
See all Natural Gas forecastsWTI Technical Analysis: USOIL Tests $100.60 as $102.45 Comes Into Focus
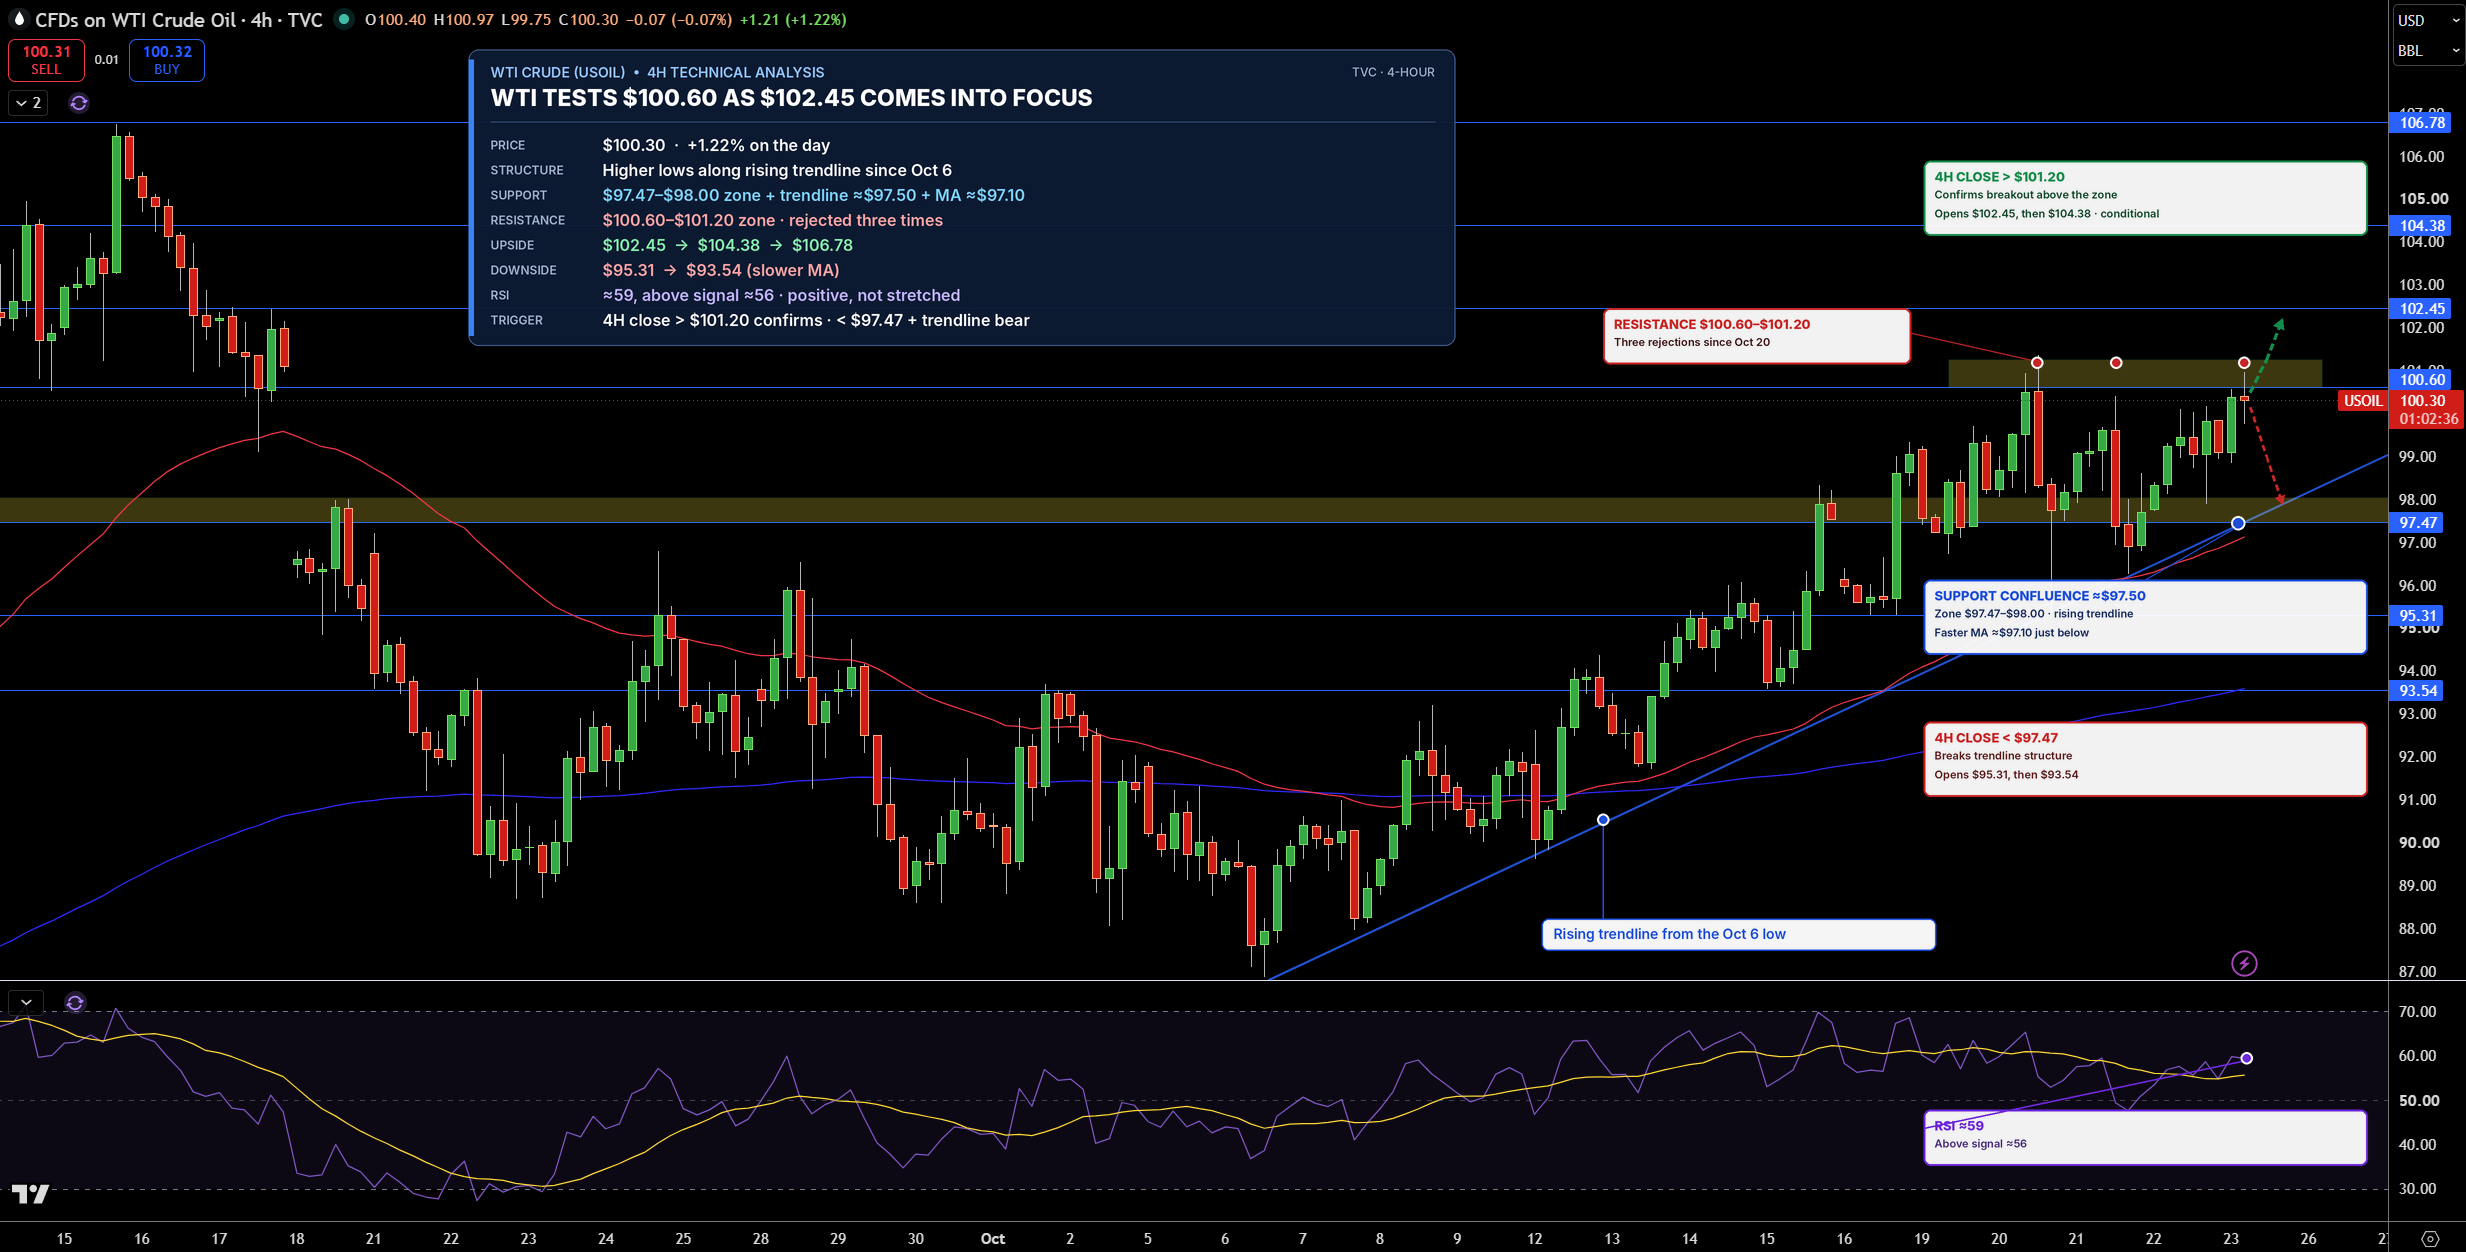
WTI crude is trading near $100.30 on the 4-hour chart and is pressing into the $100.60 to $101.20 resistance zone for the third time this week. The rising trendline from the early October low keeps lifting the structure, and buyers have defended the $97.47 to $98.00 zone on every dip. Both moving averages are rising below price, so the uptrend is intact.
A clean break above $101.20 would open the way for $102.45 and then $104.38. On the downside, the key floor is $97.47, where the support zone meets the rising trendline. If that level breaks, $95.31 and $93.54 come back into play.
RSI is near 59 and above its signal line near 56, so momentum is building without being overbought. I lean bullish while WTI holds above $97.47. A sustained close above $101.20 would confirm the breakout, while a break below $97.47 and the trendline would point to a deeper pullback.
Brent Technical Analysis: UKOIL Breaks Above $112.05 as $115.77 Comes Into Focus
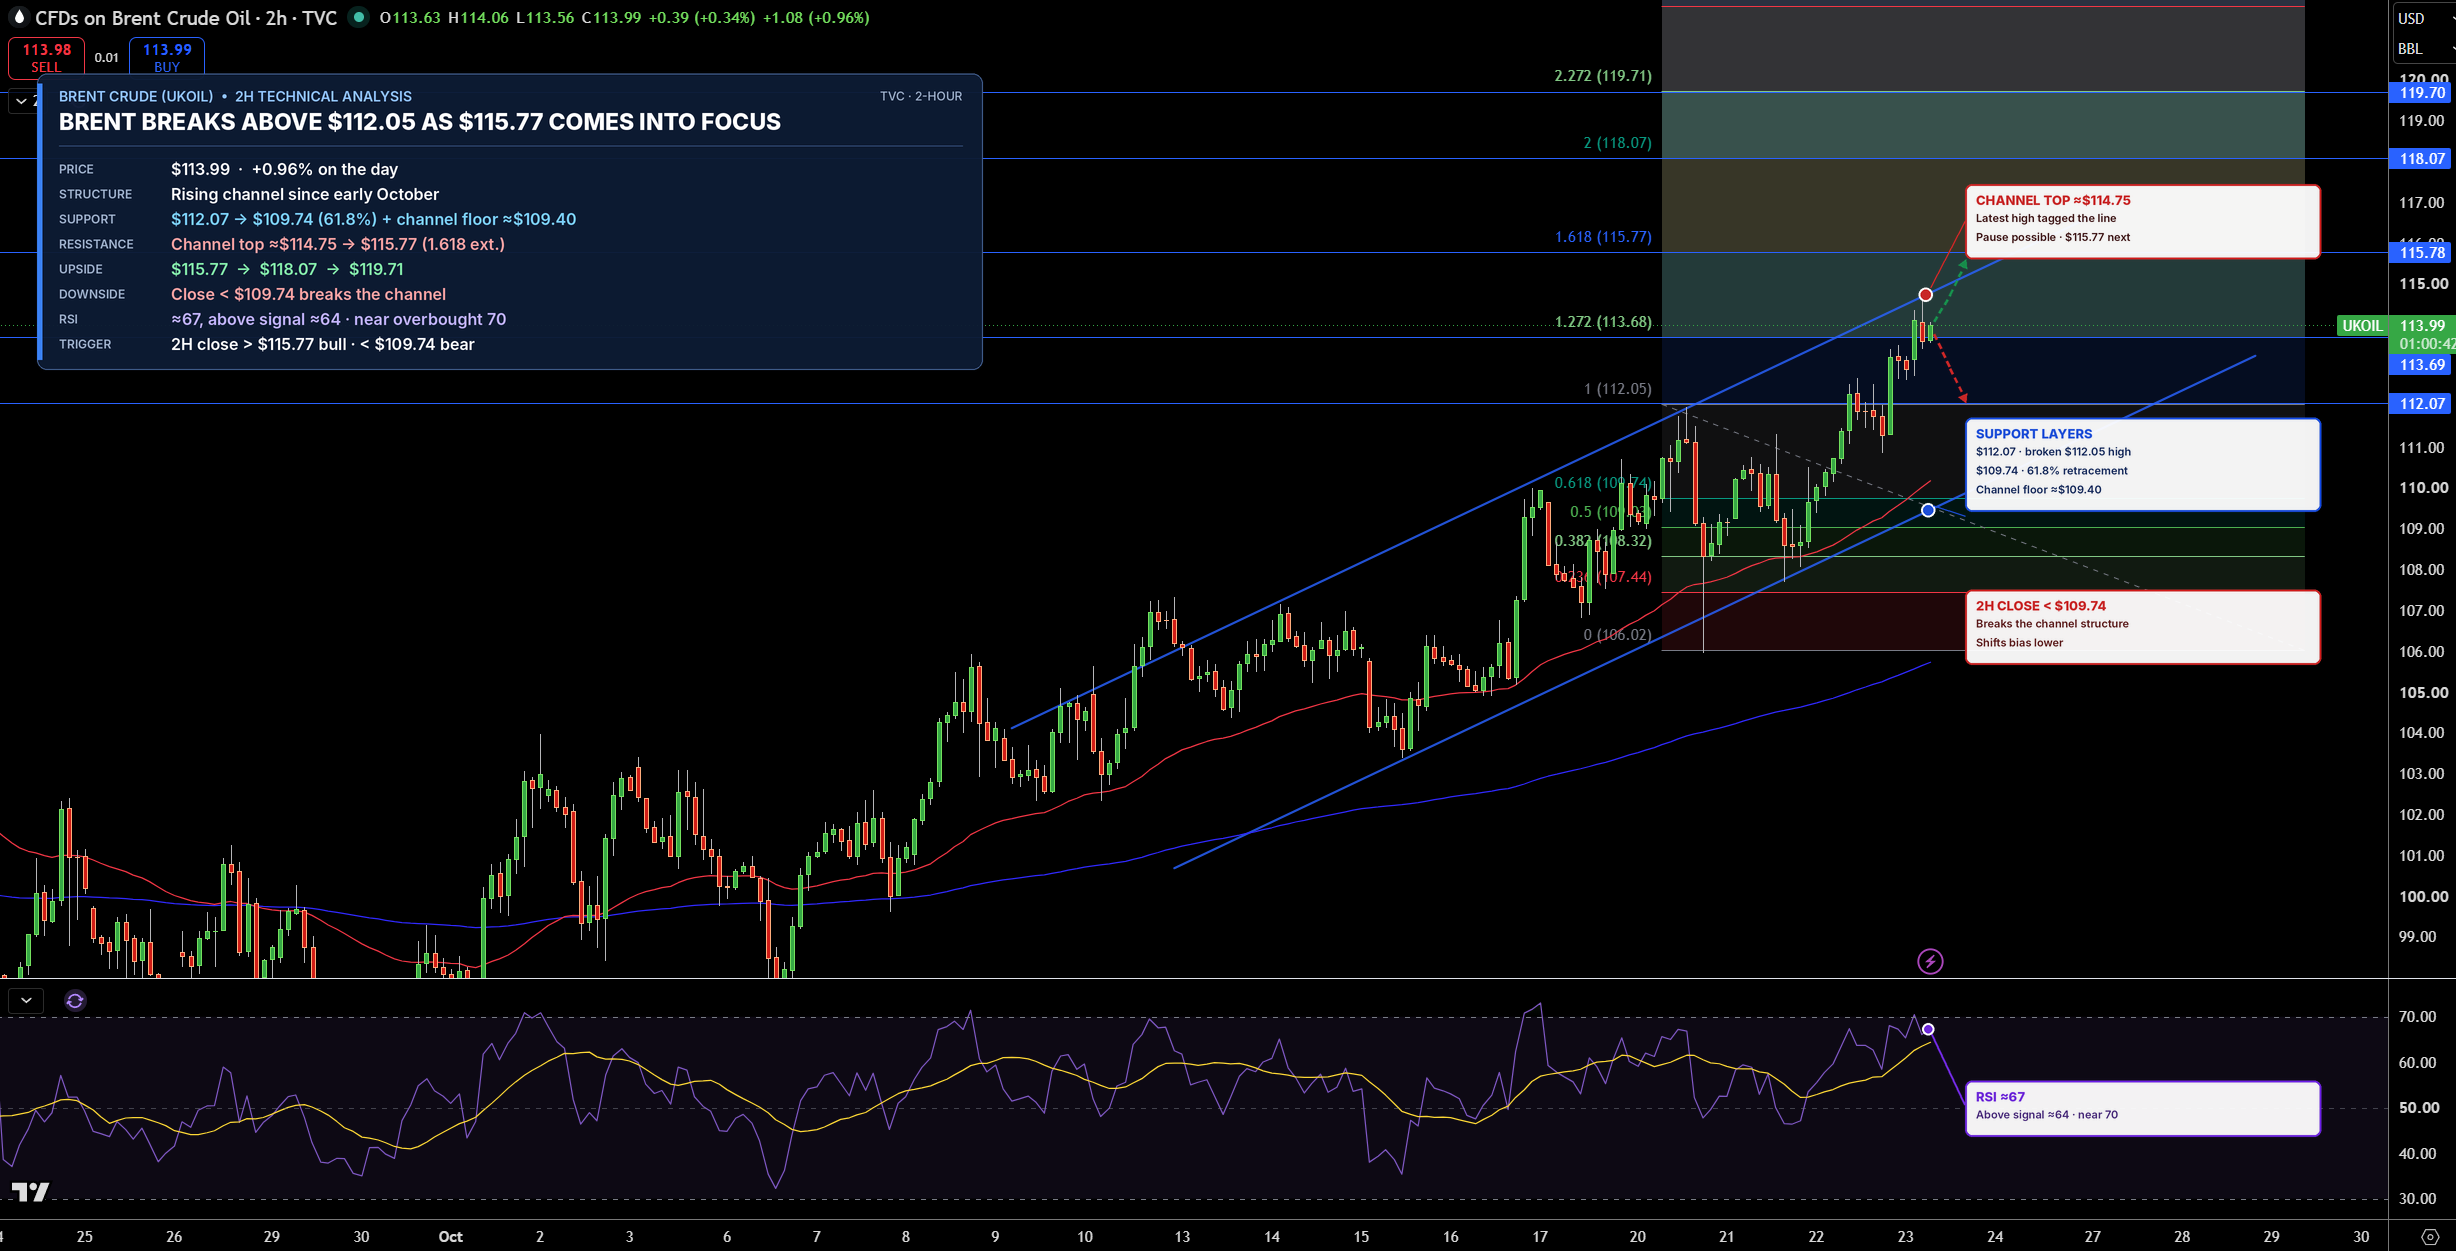
Brent is trading near $113.99 on the 2-hour chart after a clean breakout above the $112.05 high, a move that extends the rally within the rising channel that has guided prices since early October. Price is now sitting at the 1.272 Fibonacci extension near $113.68 and pressing against the upper channel line. Both moving averages are rising well below price, so the trend is clearly with buyers.
The next target is $115.77, the 1.618 extension. Above it, $118.07 and $119.71 come into view. On the downside, $112.07, just above the old $112.05 high, is the first support, followed by $109.74, the 38.2% retracement of the $106.02 to $112.05 leg and close to the channel floor.
RSI is near 67 and above its signal line near 64, so momentum is strong but close to overbought. Brent has already moved into overbought territory three times in a week, so a pause at the channel top would not surprise me. The bias stays bullish while Brent holds above $112.07. A move above $115.77 would strengthen the uptrend, and only a close below $109.74 would break the channel structure.
Natural Gas Technical Analysis: NG Slips Toward $2.68 as Bearish Pressure Builds
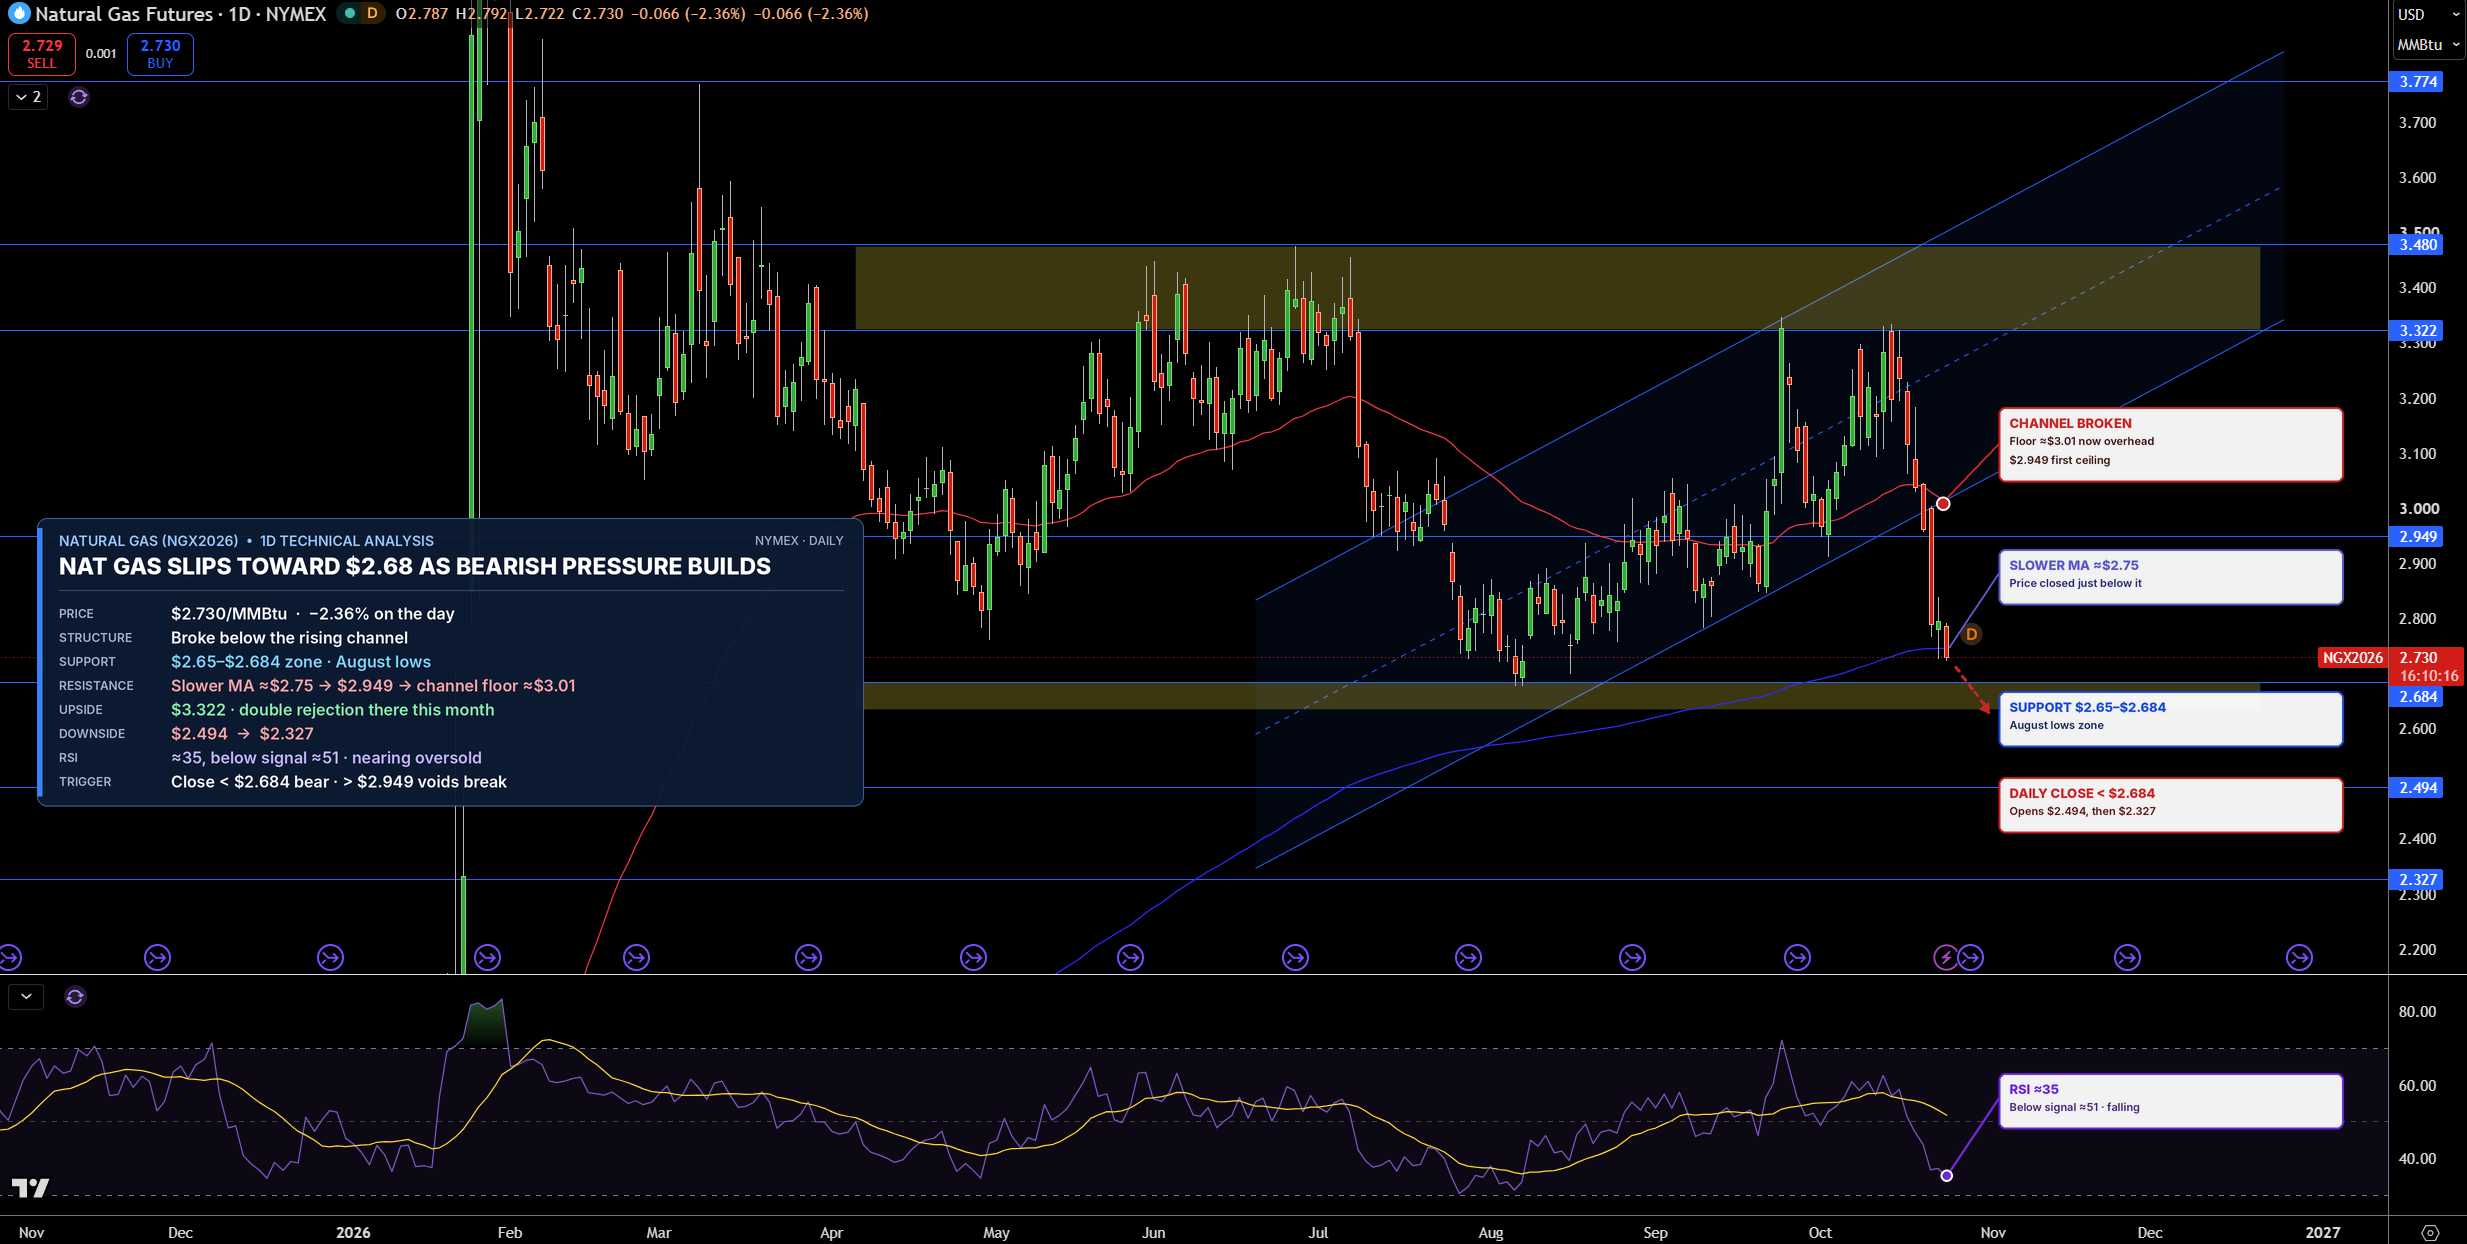
Natural gas is trading near $2.73/MMBtu on the daily chart, with sellers following through after the recent breakdown from the rising channel. Price has now slipped below the slower moving average, which had supported the market since August, and the faster average is rolling over above price. The decline started with the double rejection at $3.32 earlier this month.
The first support is the $2.65 to $2.68 zone, where the August lows formed. A daily close below it would open the way for $2.49 and then $2.33. On the upside, the slower moving average near $2.75 is the first hurdle, followed by $2.95. Above that, the broken channel floor near $3.01 now acts as a ceiling, as a broken floor often does.
RSI is near 35 and well below its signal line near 51, so bearish momentum is strong, though it is approaching oversold territory. In my view, natural gas stays bearish below $2.95. A close below $2.68 would strengthen the downside case, while a recovery above $2.95 would invalidate the breakdown.