


NOAA Guidance
NOAA’s Climate Prediction Center issued new guidance on October 20 favoring above-normal temperatures across the southern two-thirds of the contiguous United States from October 26 to October 30. Cooler-than-normal conditions are favored along the Canadian border, from the northern Rockies to the northern Plains, with a slight cooler tilt in parts of northern New England.
For October 28 through November 3, NOAA favors warmth across much of the eastern United States, except northern New England, while uncertainty increases in the West. The distinction matters because pockets of northern cold could increase heating requirements, while warmer conditions elsewhere restrain the national demand response.
The outlook does not yet justify a simple cold-weather tightening narrative. Demand depends on how far temperatures depart from normal, where that occurs, and how long the pattern persists. Forecast revisions can alter expectations before a change appears in measured consumption.
Equally, warm conditions do not make natural gas demand disappear. Power generation and industrial activity can contribute to drawing supply to lower levels.
Storage Numbers
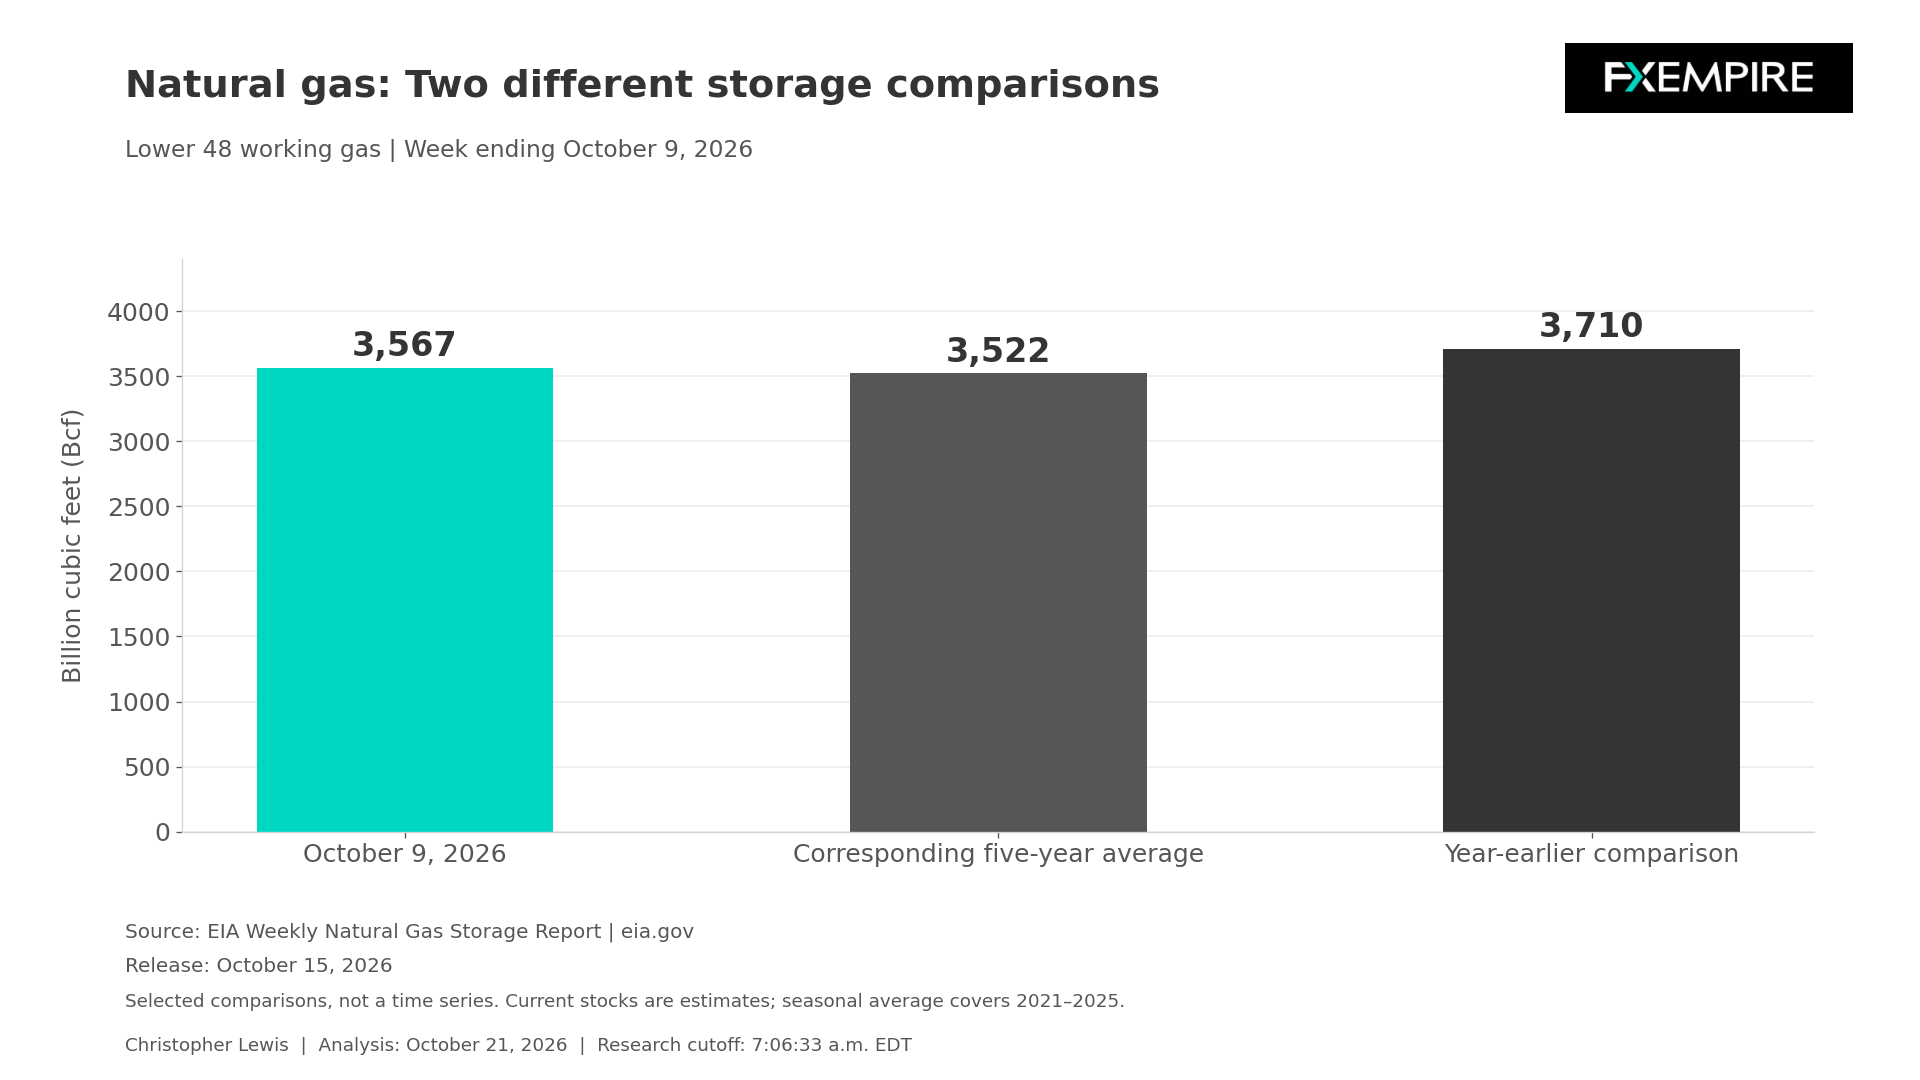
The latest EIA storage estimate still covers October 9 and was released on the 15th. Lower 48 working gas totaled 3,567 Bcf after a 67 Bcf injection. That was 45 Bcf above the corresponding previous five-year average, but 143 Bcf below the year-earlier level.
Location complicates the national assessment. South Central storage was 1,097 Bcf, below its five-year average of 1,132 Bcf, whereas the East and Midwest were above their averages. This matters for interpreting the ability and availability of stored supply, although it does not necessarily establish a pipeline constraint or shortage at Henry Hub.
LNG exports provide an additional demand channel as well. EIA’s September 1 analysis reports that U.S. LNG exports averaged 17.4 Bcf per day in the first half of 2026, 23% above the same period of 2025. That is historical evidence of a larger export requirement, not necessarily a measured demand curve of today’s terminal feed gas.
Additional export capacity and capability also differ from actual utilization. A terminal’s capacity cannot simply be added to current gas demand unless operating and flow evidence supports the change. It is also worth noting that a disruption would reduce feed gas requirements only if it affects actual operations.
Storage and exports continue to use different units that should remain separate: inventories are a stock measured in Bcf, while export volumes are a flow measured per day over a stated period. Comparing their numerical sizes directly misrepresents the balance.
Natural Gas Price Forecast
Every new Natural Gas analysis as it publishes, today's technical signal and key levels, live price — on one page.
See all Natural Gas forecastsEIA Projections
It is worth questioning how production, domestic consumption, and exports together determine the rate at which storage builds, or withdrawals occur. The October Short-Term Energy Outlook from the EIA projects end-October storage of 3,850 Bcf, roughly 2% above the five-year average. Published on October 6, the forecast was completed October 1 and therefore predates the latest NOAA weather estimates.
The next EIA storage release is scheduled for tomorrow and will be watched closely. A smaller build combined with a colder forecast is exactly what natural gas bulls will need for a tightening-balance story. Continued injections and persistent warmth would weaken that scenario.
From a Technical Analysis Standpoint
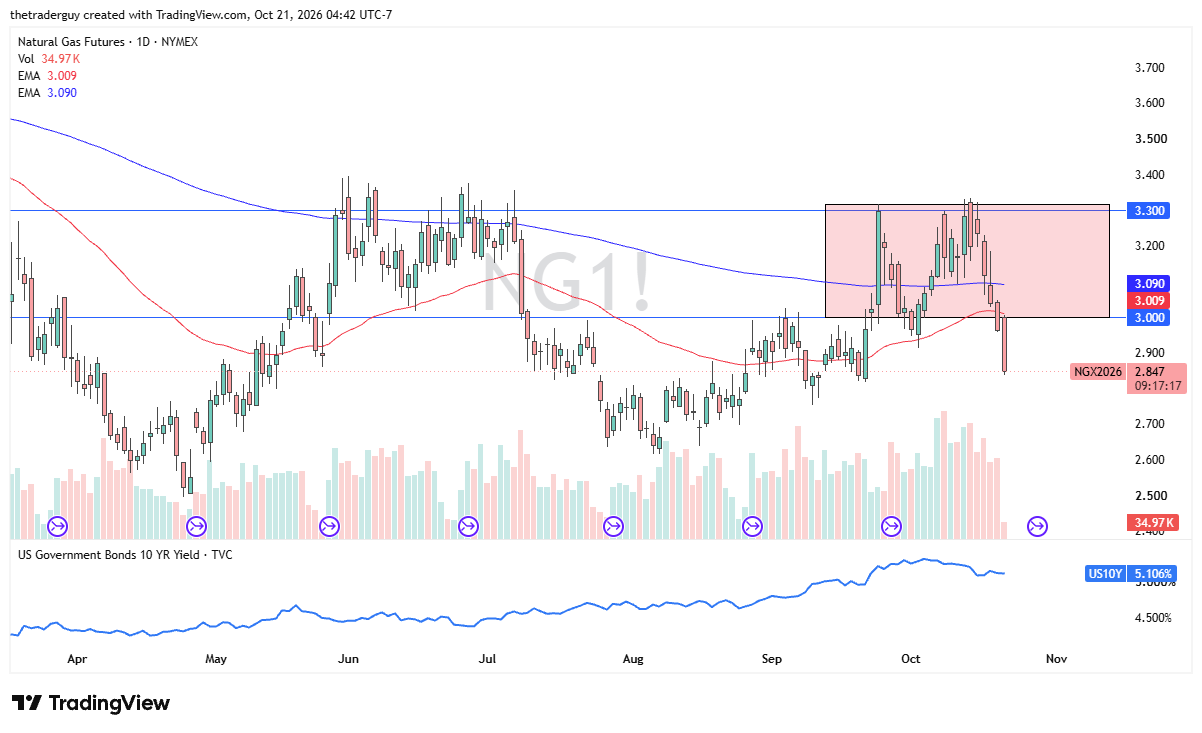
We have seen the natural gas market collapse early during the trading session, and of course, with that being the case, it is more likely than not going to be a scenario where some value hunters could come back into the fray.
That being said, it is also worth noting that the Iranians said they were ready for diplomacy but will defend themselves. Some of what we are seeing is relief in the minds of traders when it comes to Dubai and, perhaps more importantly, Qatari natural gas exports.
Nonetheless, we are getting close to an oversold condition yet again, and a bounce is something that I will be watching, although I would need at least 24 hours to be convinced of it.