


Natural gas in the United States faces a weather-related demand headwind ahead of today’s storage report. NOAA’s Climate Prediction Center outlook, issued at 3 p.m. Eastern yesterday, favors above-normal temperatures across most of the contiguous United States for November 10–14. The highest probabilities, 80%–90%, cover the Northern Plains and much of Minnesota.
This is a forecast of temperature categories, not necessarily an observation of what consumption will be. For Henry Hub, the implication is conditional, but it is relevant. Mild temperatures in heating-sensitive regions, such as Minnesota, can reduce the amount of gas needed relative to normal seasonal conditions. This can help preserve storage and delay the development of a stronger winter demand premium.
Storage Report
The latest published EIA storage report, released October 29 and covering the week of October 23, showed working gas totaling 3,724 billion cubic feet after an 80 billion cubic feet injection. Inventories were 38 billion cubic feet above the five-year average, but 147 billion cubic feet below the comparable year-earlier level. Today’s release is scheduled for 10:30 a.m. Eastern and could change the overall outlook.
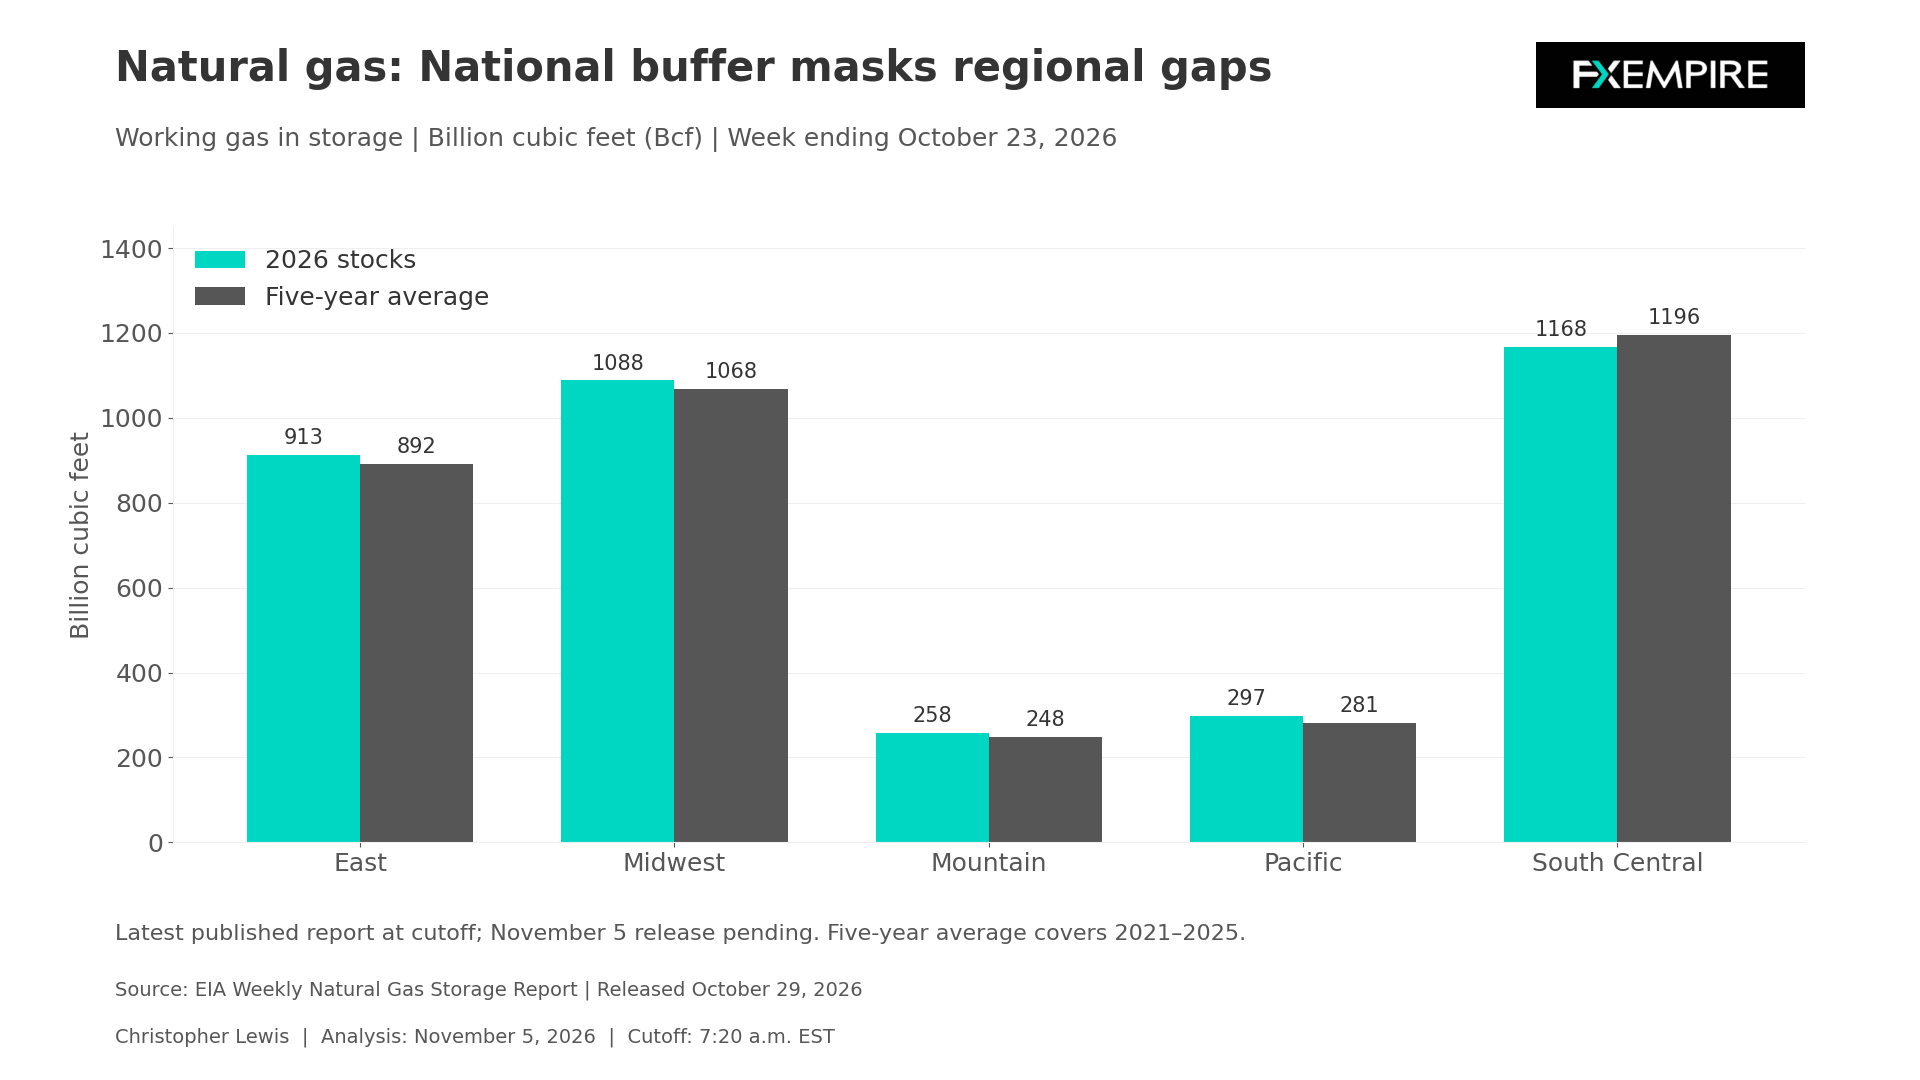
The regional background is especially useful. South Central inventories were 1,168 billion cubic feet versus a five-year average of 1,196 billion cubic feet. Its salt facility stocks were 274 billion cubic feet against an average of 310 billion cubic feet. The East and Midwest were above their seasonal averages as well. The national total, therefore, conceals a less comfortable position in part of the country.
Regional Balances
At this point, I believe that regional balances deserve attention alongside the headline injection. An apparently comfortable national figure may offer less reassurance if demand rises where storage is relatively lean, or if transportation becomes somewhat constrained. However, the regional data by itself does not necessarily establish a pipeline bottleneck or problems with delivery. The balance for an analyst right now will be between additional supply and additional demand.
EIA’s Monthly Outlook
The EIA’s October monthly outlook provides broader context. Completed October 1 and released on October 6, it forecast end-of-October inventories of about 3,850 billion cubic feet. That was a projection, not a measured stock level. Its 2026 forecast included dry production of 112.2 billion cubic feet per day and LNG exports of 17.6 billion cubic feet per day, rising to output of 116.13 billion cubic feet per day and 18.6 billion cubic feet per day next year. The next outlook is scheduled for November 10.
Natural Gas Price Forecast
Every new Natural Gas analysis as it publishes, today's technical signal and key levels, live price — on one page.
See all Natural Gas forecastsLNG capacity matters only to the extent that facilities operate and take feed gas. Production growth matters only if it reaches storage or consumers. Annual forecasts do not resolve the daily balance during a cold spell, which of course is possible this time of year.
For today’s storage release, the change in seasonal surplus, the regional distribution, and revisions are going to be important. A larger inventory cushion would reinforce the effect of a mild forecast. A shrinking cushion could provide some support, particularly if weather updates start to turn colder. Weather revisions after the release may be just as consequential as the reported injection. Storage describes a completed week, while the forecast influences expectations for the weeks ahead.
Technical Analysis
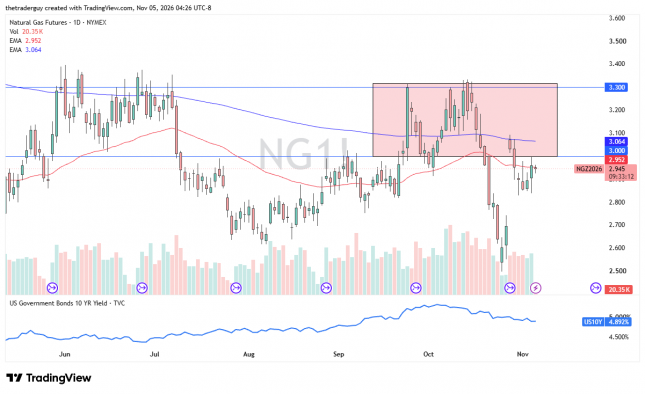
For the technical analysis in natural gas, it appears to be a market that still favors buying dips, but it also has a considerable psychological barrier in the form of $3, as well as the 200-day EMA, which currently sits at the $3.06 level. Ultimately, I like buying dips in natural gas this time of year, but the weather has not so far been very cooperative.
If you’d like to know more about how to trade natural gas, please visit our educational area.