


Natural Gas Technical Analysis
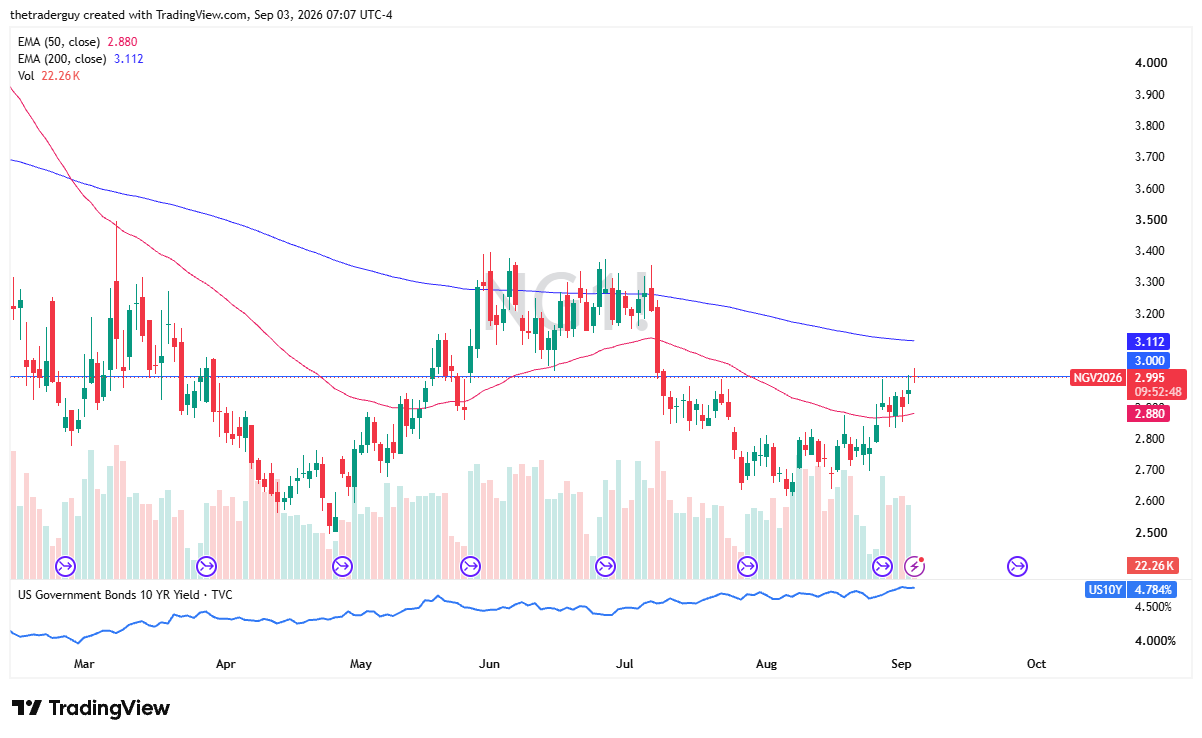
The natural gas market has gapped higher to kick off the trading session here on Thursday, testing the $3 level. The $3 level, of course, is a large, round, psychologically significant figure that a lot of people will be watching. And, of course, it’s right now halfway between the 50-day EMA and the 200-day EMA indicators.
Ultimately, this is a market that will continue to be noisy, but I also recognize that natural gas is coming out of the weakest part of the year. So, I’m starting to shift my bias from bearish to bullish. Right now, I’d say I’m neutral.
Seasonal Demand and Technical Levels
Pullbacks are likely still based on historical norms, but even if the market does pull back, generally speaking, this time of year it’s quite common to see those pullbacks get softer and softer. After all, we are trading the October contract, and in late October in the United States, you start to see heating come into the picture. That being said, supply is at a record level, so that is part of what’s going on here.
Plus, we have the wild card this year of a potential increase in exports to the European Union. That might be a necessity, not just that agreement that they signed last year with the Trump administration, because the flow of natural gas out of the Middle East is still a bit of a question at this point.
Short-term pullbacks will have me looking at the 50-day EMA as potential support. A break to the upside, I’ll be waiting to see if the 200-day EMA causes a bit of a bump along the road at $3.11.
Again, I’m not bullish, but I’m not bearish anymore. I’m looking for ranges to play at this point.
Natural Gas Price Forecast
Every new Natural Gas analysis as it publishes, today's technical signal and key levels, live price — on one page.
See all Natural Gas forecastsIf you’d like to know more about how to trade natural gas, please visit our educational area.