


Natural Gas Traders Wait for Confirmation of Colder Weather
December natural gas futures are slightly lower early Wednesday after recovering from a one-week low and settling sharply higher on Tuesday. The rally came as forecasts added some demand for early next week. Commodity Weather Group is calling for below-normal temperatures in the central and eastern U.S. toward the end of November.
Tuesday’s rally was likely fueled by short-covering, but traders may need to see the cooler weather stay in the forecast before extending the move. The next test could come with the mid-session weather updates, when traders will be looking at how cold it gets and how long it lasts.
The forecasts are not all pointing to a major demand event. NatGasWeather says conditions remain bearish over the next six days, and the 10–15-day forecast is not quite cold enough, especially in the European model. It expects light demand over the next seven days, with little subfreezing air accompanying weather systems moving across the country.
Traders are also watching El Niño, which could bring a warmer winter and reduce heating demand. That may explain why April natural gas futures remain weak, even as December prices respond to cooler forecasts.
Daily December Natural Gas Futures Technical Analysis
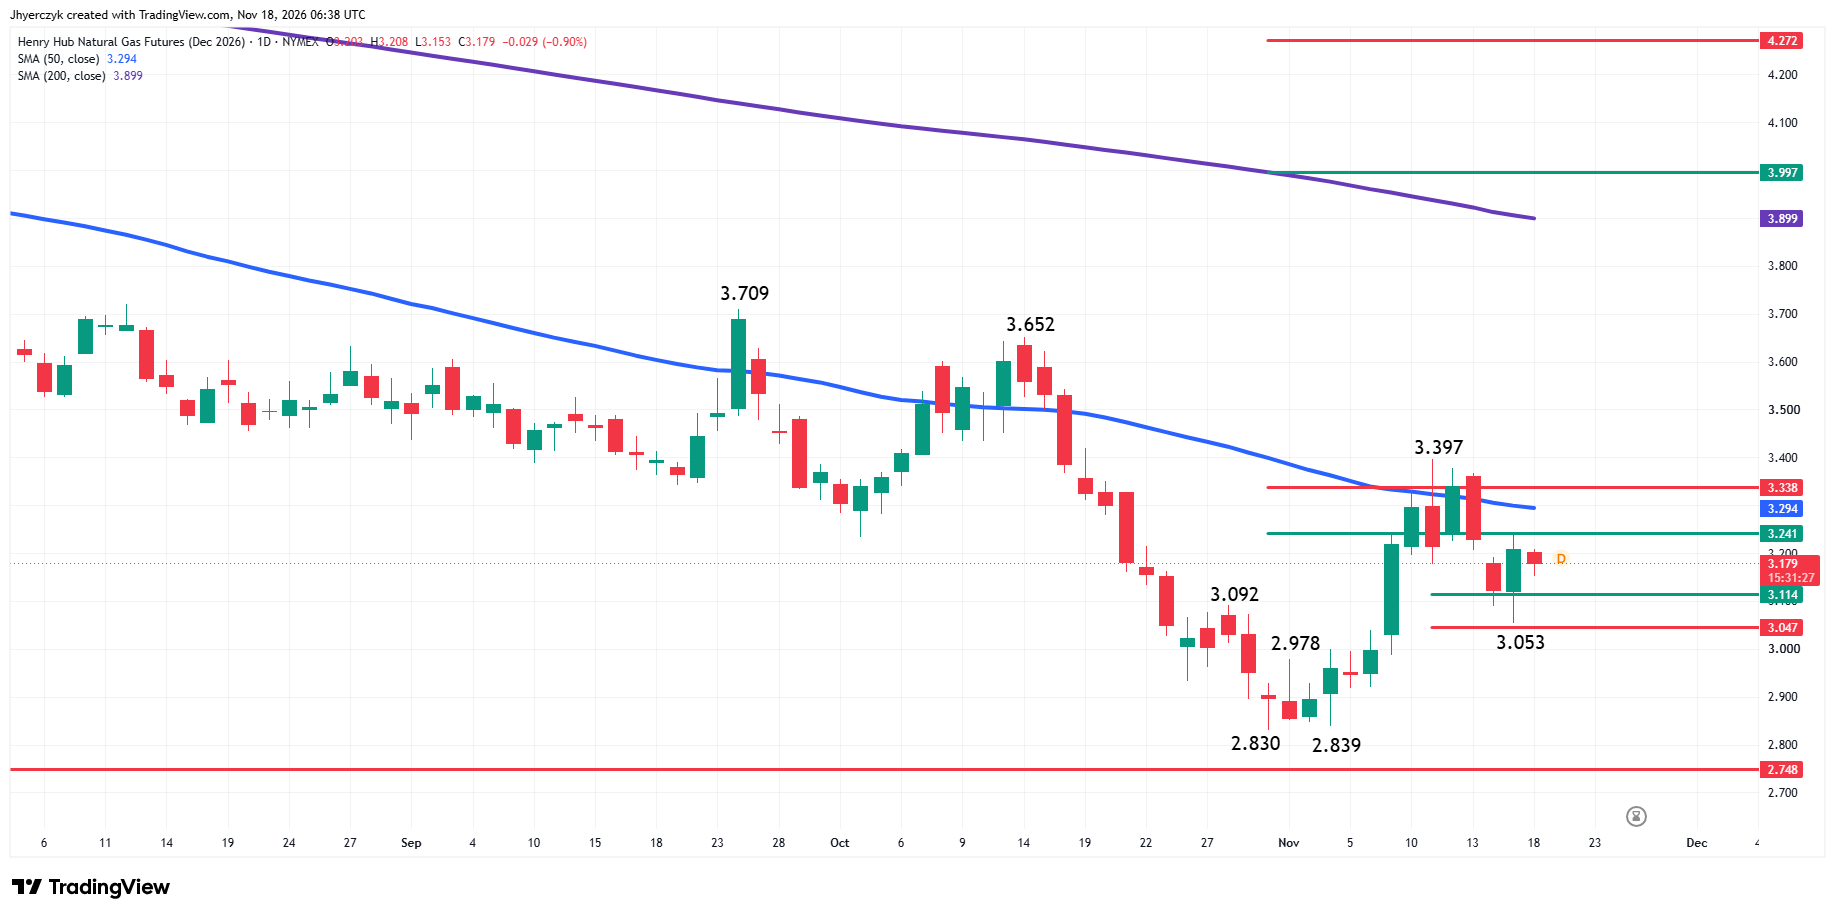
December natural gas futures traders will be trying today to follow-through to the upside after yesterday’s minor reversal from inside a short-term retracement zone. Over the next few sessions, the main objective will be to form a secondary higher bottom, overcome the 50-day moving average and reaffirm the uptrend.
The main trend is up according to the daily swing chart. However, a closing price reversal top on November 11 killed the upside momentum, leading to the current pullback. A trade through $3.397 will reaffirm the uptrend. Taking out the swing bottom at $2.830 will change the main trend to down.
The minor trend is down. The confirmation of the closing price reversal top changed the minor trend to down. Tuesday’s break to $3.053 reaffirmed the minor trend.
The short-term range is $2.830 to $3.397. Its retracement zone at $3.114 to $3.047 stopped the selling at $3.053.
The intermediate range is $3.652 to $2.830. Its retracement zone at $3.241 to $3.338 played a role in stopping last week’s rally at $3.397. The 50-day moving average at $3.294, which can be both a trend indicator and resistance is inside the intermediate retracement zone.
The long-term 200-day moving average is potential resistance at $3.899. It drops in just in front of the long-term retracement zone at $3.997 to $4.272.
Natural Gas Price Forecast
Every new Natural Gas analysis as it publishes, today's technical signal and key levels, live price — on one page.
See all Natural Gas forecastsDaily April Natural Gas Futures Technical Analysis
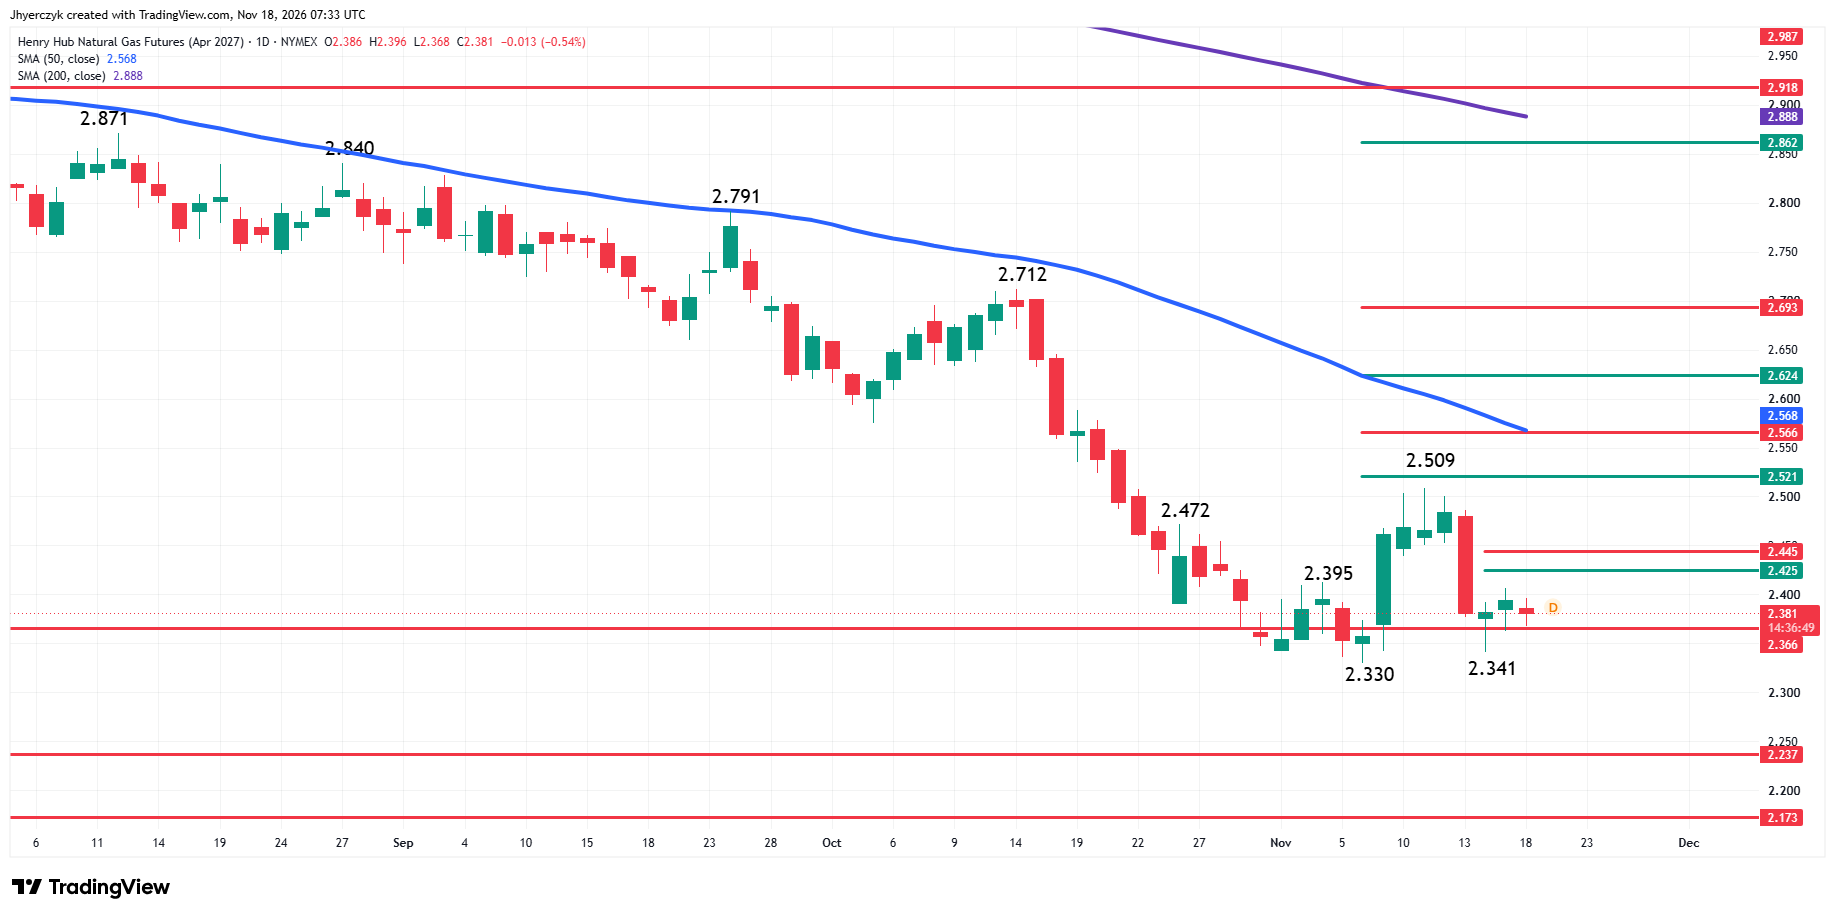
April natural gas futures are in an uptrend according to the daily swing chart, but the trend is much weaker than the nearby December futures contract. This may be because of the potential impact of the Super El Nino this winter.
A trade through $2.330 will change the main trend to down. Taking out the swing top at $2.509 will signal a resumption of the uptrend. A new minor bottom was formed at $2.341 on Tuesday.
The new minor range is $2.509 to $2.341. Its retracement zone at $2.425 to $2.445 is the first upside target. This is followed by the short-term retracement zone at $2.521 to $2.566, followed by the 50-day moving average at $2.568.
What to Watch
December Natural Gas
The uptrend on the main swing chart and the successful test of the short-term retracement zone at $3.114 to $3.047 are supporting my upside bias on Wednesday. However, I’m going to need further proof that there is real buying behind this move and not just short-covering. Overcoming the 50-day moving average at $3.294 will be the first sign of strength. I’ll gain more confidence in my outlook if buyers can take out the intermediate 61.8% level at $3.338. These moves could create the upside momentum needed to reaffirm the uptrend on a breakout over the main swing top at $3.397.
My chartwork indicates that there is room to run over $3.397 with a pair of main tops at $3.652 and $3.709, potential targets.
My upside bias will weaken if the short-term 61.8% level at $3.047 is taken out with conviction.
April Natural Gas
My bias will be to the upside as long as the main bottom holds at $2.330. However, I realize there are barriers to overcome like the minor retracement zone at $2.425 to $2.445 in order to generate the upside momentum needed to reaffirm the uptrend on a breakout over the main swing top at $2.509.
It’s going to take a lot more than short-covering also to sustain the rally through the 50-day moving average at $2.568, which ultimately may decide if a prolonged rally is developing.
If $2.330 fails to hold then the trend will change to down and the market will have to reset for the next attempt to rally. However, the daily chart indicates that the new base-building may not begin until the next support zone at $2.237 to $2.173 is tested.
More Information in our Economic Calendar.