



EIA Storage Report Could Trigger Volatility
December natural gas futures are a little better ahead of today’s U.S. Energy Information Administration (EIA) weekly storage report, due to be released at 14:30 GMT. The guesses for this week are wide at 68 Bcf to 75 Bcf. This could be the source of volatility, depending on which way the market is leaning.
With the main trend down on the daily chart, bearish traders are likely to react stronger to the high end of the range or any number that comes in higher than expected. Counter-trend traders who have been building a support base most of week may react positively to a low number or a miss to the downside.
The current amount of gas in storage is 3644 Bcf. The EIA is forecasting about 3850 Bcf at the end of October, about 2% above the five-year average.
Weather Outlook Remains Bearish
Overnight, I didn’t find any significant changes in the near-term weather outlook. NatGasWeather is looking for light demand over the next 7 days. Over the next 15 days, it sees weather patterns that are “quite bearish”. Commodity Weather Group added some cooling, but overall, it sees above-average temperatures in the high-demand eastern United States through November 6.
LNG Supports Nearby While El Niño Weighs on Deferred
Nearby markets are getting some support from improving LNG flows, while the deferred futures markets are still pricing in the potential impact of the Super El Nino this winter that could bring warmer temperatures to the north, leading to lower demand and higher storage ahead of the summer cooling season.
Daily December Natural Gas Futures Technical Analysis
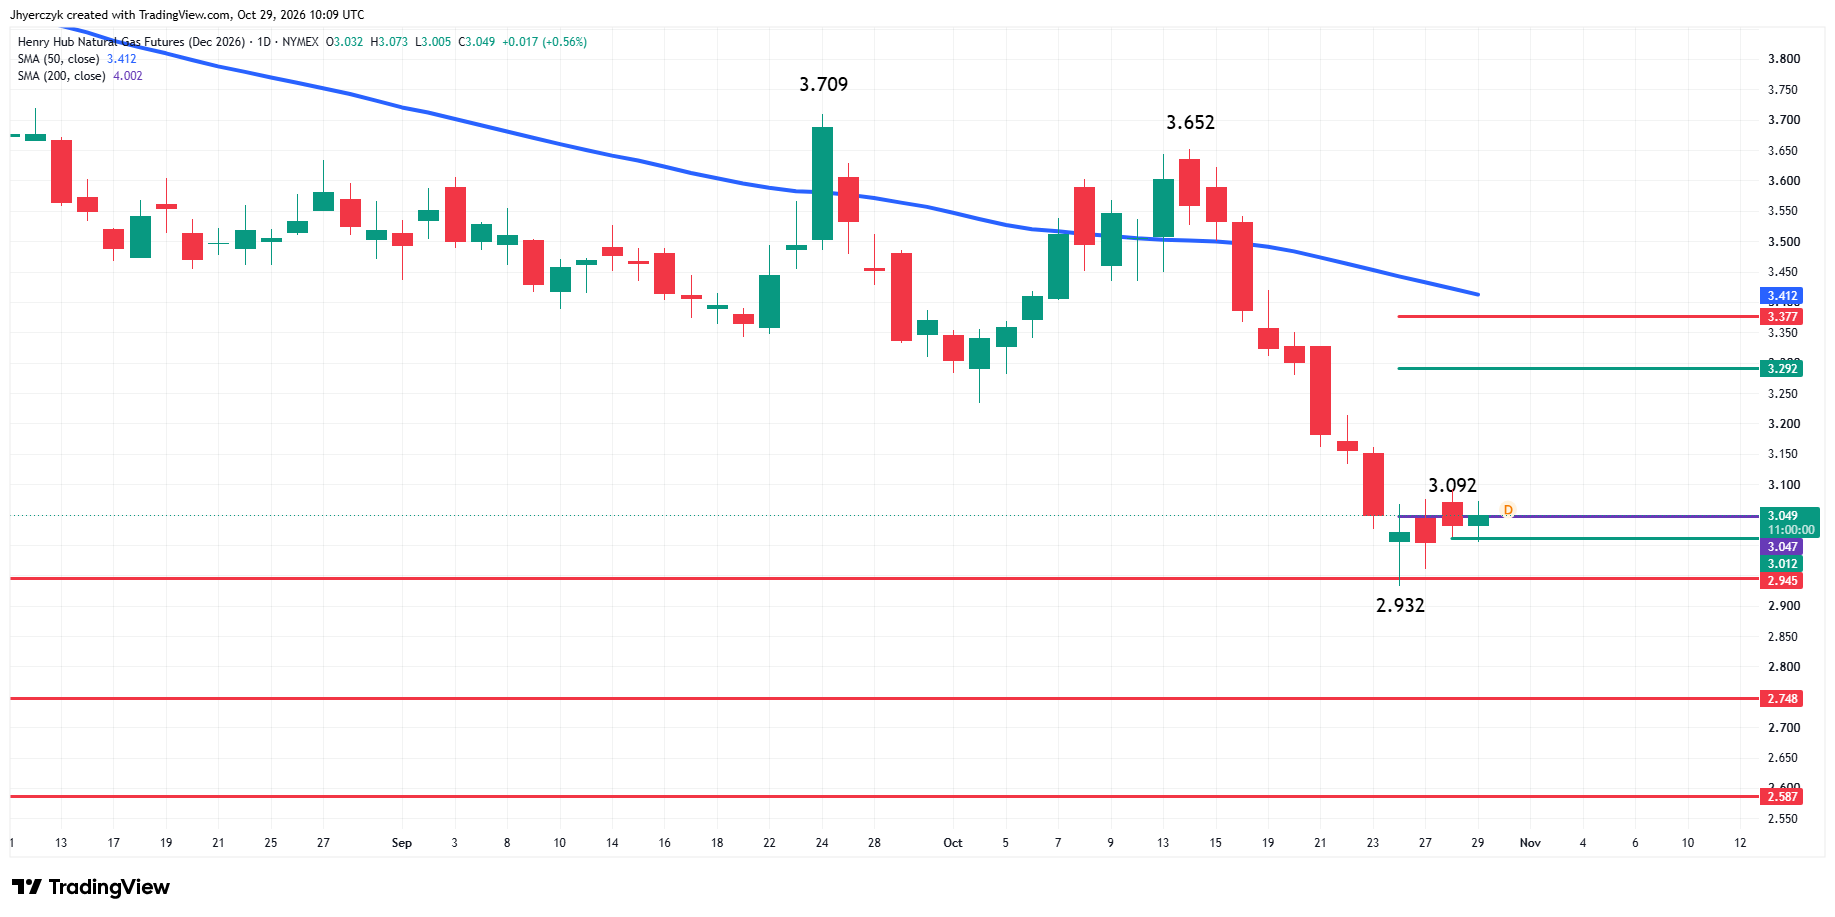
December natural gas futures are slightly higher early Thursday as prices continue to consolidate near multi-month lows, following a steep eight-session retreat.
The main trend is down according to the daily swing chart. A trade through $3.652 will change the main trend to up. Taking out the swing bottom at $2.932 will signal a resumption of the downtrend.
Natural Gas Price Forecast
Every new Natural Gas analysis as it publishes, today's technical signal and key levels, live price — on one page.
See all Natural Gas forecastsThe minor trend is also down. A new minor top has formed at $3.092. Taking out this level will change the minor trend to up and shift momentum to the upside.
The minor range is $2.932 to $3.092. Trader reaction to its 50% level at $3.012 is likely to set the tone on Thursday.
The main range is $3.652 to $2.932. Its retracement zone at $3.292 to $3.377 is the primary upside target. This is followed by the 50-day moving average at $3.412, which is providing trend guidance and likely resistance.
Last week’s close at $3.047 is also an important level to watch especially on Friday. The market started the week with a lower low. A close above $3.047 on Friday could produce a potentially bullish closing price reversal bottom. If confirmed, this could lead to a 2-to-3-week counter-trend rally.
The market is always giving traders choices. This is one of those cases where the main trend is down, but the minor trend is threatening to turn up.
Daily April Natural Gas Futures Technical Analysis
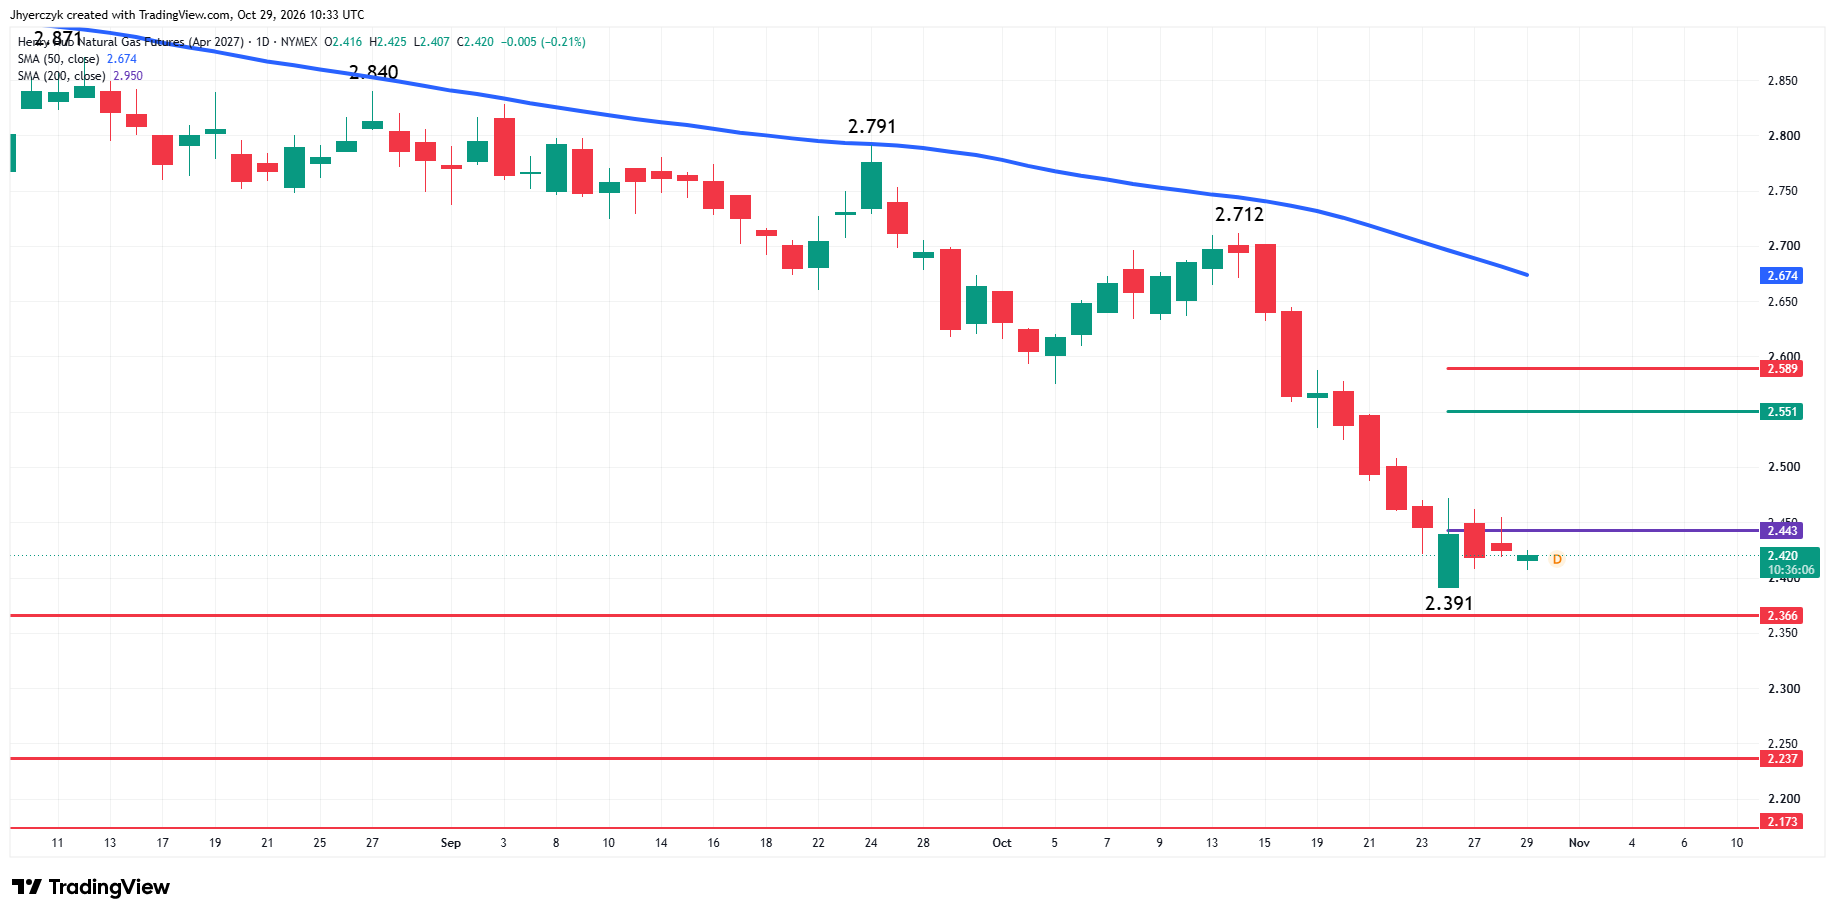
April natural gas futures are inching lower early Thursday. The main trend is down according to the daily swing chart. A trade through $2.712 will change the main trend to up. Taking out $2.391 will signal a resumption of the downtrend.
So far this week, we really haven’t seen any significant minor price swing activity, just consolidation inside Monday’s wide range of $2.472 to $2.391. Additionally, the market remains on the weak side of last week’s close at $2.443.
The bearish swing chart and the prolonged trade under the 50-day moving average have me leaning to the downside until the market breaks the pattern.
Some may see the consolidation inside $2.472 to $2.391 as setting up for a potential upside breakout and a relief rally into the retracement zone at $2.551 to $2.589. Others may see it as a temporary stop before a plunge through $2.366.
What to Watch
December Natural Gas Futures
Trading below the 50-day moving average and in the direction of the swing chart trend indicator is giving me a downside bias. However, the minor trend formation is weakening that outlook a little.
Holding the 50% level at $3.012 will indicate the presence of counter-trend buyers. If the move creates enough upside momentum to overtake $3.047 and the minor top at $3.092 then the outlook for the main trend could weaken further with $3.292 the next potential upside target.
So far this week, it looks as if counter-trend traders are trying to build a support base so a move to $3.292 may take days or even weeks to develop. I’m just saying that if you’re short because of the downtrend, you may have risk all the way up to $3.292.
If $3.012 can’t hold as support then we could see a retest of $2.932. If this fails then $2.748 will hit the radar.
April Natural Gas Futures
I’m looking for the downtrend to continue, but my short-term outlook will weaken on a Friday close over $2.443, or if $2.472 is taken out.
Since the market posted a lower low earlier in the week, a close above $2.443 on Friday could produce a potentially bullish weekly closing price reversal bottom. If confirmed, this could lead to a 2-to-3-week counter-trend rally.
More Information in our Economic Calendar.