Gas Holds Its Floor but Buyers Are Not Chasing
The rally stalled. October natural gas is sitting on the strong side of the 50-day moving average with the trend still pointing down. Europe is paying near-2022 prices for winter gas and U.S. LNG exports just hit 19.9 Bcf per day.
Hotter weather is keeping power burn elevated later into September than anybody expected. All of that built a floor. None of it started a breakout. The problem is the same one it has been for months. Production at 114.4 Bcf per day and storage above the five-year average give bears enough ammunition to cap every rally before it gets going.
At 11:58 GMT, October natural gas is trading $2.897, up $0.01 or +0.03%.

Europe Is Paying Panic Prices for Winter Gas
Dutch TTF jumped more than 5% Monday to €83.75 per megawatt-hour. That is late 2022 pricing. European storage sat at 68% full as of September 12 against a five-year average of 84%. Winter buying has started and the tanks are not ready. ING said Europe will struggle to reach even 75% before heating demand picks up. The Strait of Hormuz is still closed and the Middle East LNG that Europe counted on to fill the gap is not flowing.
That is landing directly on the U.S. market. LNG export flows hit 19.9 Bcf per day Monday, up 2.9% from the prior week. At these TTF levels, every Gulf Coast terminal has a reason to keep running flat out and every molecule that ships overseas is a molecule that does not go into domestic storage. Europe’s panic is real and it is pulling on the U.S. balance sheet right now.
The Heat Is Real and the Generation Data Proves It
The Commodity Weather Group pushed above-average temperatures across the South through September 28. That is air-conditioning demand extending a full week later into September than the market had expected.
The Edison Electric Institute backed it up with numbers. Lower-48 electricity output rose 19.69% from a year earlier in the week ended September 5 to 100,302 gigawatt-hours. The 52-week total through September 5 was up 3.0% to 4.39 million gigawatt-hours. That is not a computer model change. The generation is already running higher and the forecast says it does not fade yet.
Natural Gas Price Forecast
Every new Natural Gas analysis as it publishes, today's technical signal and key levels, live price — on one page.
See all Natural Gas forecastsTuesday’s flat trade tells you the problem. The market already priced the heat. Late-summer warmth is holding demand up but it is not enough by itself to start a rally when production is this high. The weather needs help from Thursday’s storage number or a widening of the European premium to turn the floor into a launching pad.
Production Keeps Winning the Argument
Lower-48 dry gas production hit 114.4 Bcf per day Monday, up 5.2% from a year ago according to BNEF. Demand came in at 74.2 Bcf per day, up 7.7% year-over-year. Demand is improving faster than production is growing. The gap is still too wide for bulls to close without a sustained drop in output or a storage surprise.
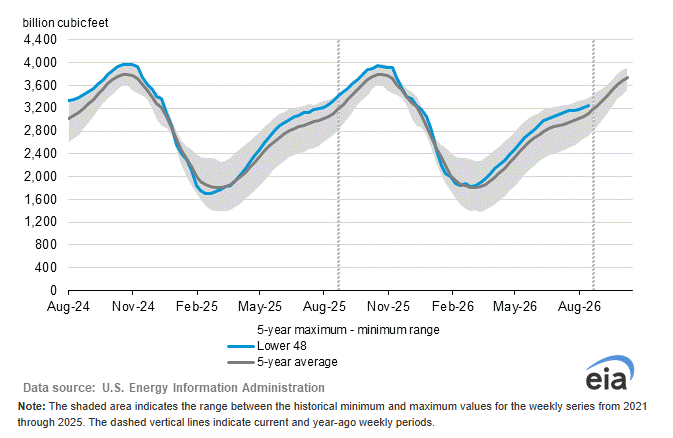
Last week’s EIA report showed a 40 Bcf injection against a 34 Bcf estimate. Larger than expected. The five-year average build was 52 Bcf so the number looks relatively tight on a seasonal basis. Storage as of September 4 was 4.8% above the five-year average and the EIA projects inventories hitting 3,985 Bcf by end of October. That would be the highest end-of-October level in 10 years.
Baker Hughes added two gas rigs Friday bringing the count to 132, just below the three-year high of 134 from February. More rigs means more production coming online in the months ahead. The EIA also raised its 2027 dry-gas production forecast to 116.0 Bcf per day from 115.3.
The Super El Niño forecast sitting over the Northern Hemisphere adds the medium-term risk. Warmer-than-normal conditions this fall and winter cut heating demand. That is not a problem today. It is the reason rallies keep finding sellers before they can build any real momentum.
Daily October Natural Gas Technical Analysis
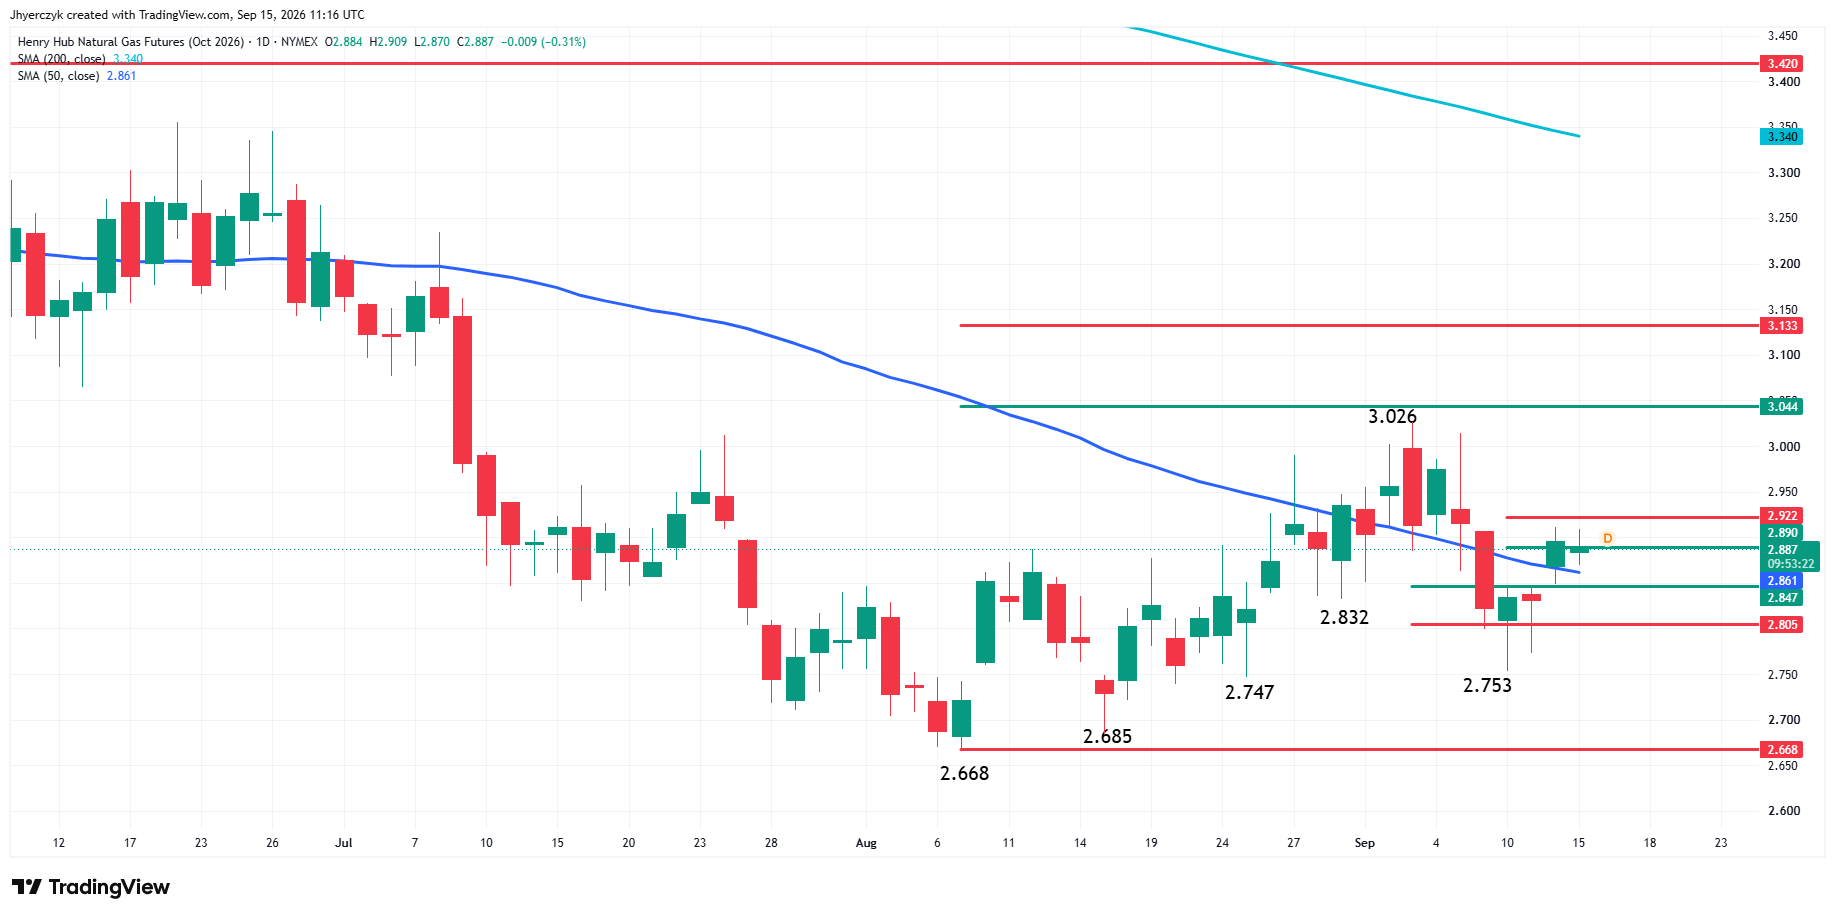
October natural gas futures are nearly flat shortly before the regular session opening on Tuesday. There seems to be a stalemate at a minor resistance zone with swing chart traders leaning bearish and 50-day moving average traders hoping for a shift in momentum to the upside.
The main trend is down according to the daily swing chart. A trade through $3.026 will change the main trend to up. A move through $2.753 will reaffirm the downtrend. The 50-day moving average is at $2.862.
The short-term range is $2.668 to $3.026. Its retracement zone at $2.847 to $2.805 is a potential support zone. Last week, the market broke through it to $2.753, however, quickly regained it. The minor range is $3.026 to $2.753. Its retracement zone at $2.890 to $2.922 is currently acting as resistance.
What to Watch
TTF near €84 is the story that changed this week. If European prices stay at these levels or push higher, the LNG pull on U.S. supply does not let up regardless of what domestic weather does. A drop in Middle East flows through Hormuz would widen the gap further. That is the bullish variable that has not been fully priced into Henry Hub yet.
Domestically, the weather models Tuesday and Wednesday will tell traders whether the southern heat extends past September 28 or starts to break. Production at 114.4 Bcf per day is the wall every rally has to climb. Thursday’s storage report is where the whole week comes together. The surplus has been the bears’ best argument all year. A build under 30 Bcf starts to chip away at it. Anything above 40 Bcf and the production story wins again.
The bias leans bearish with the main trend down on the daily swing chart. The 50-day moving average at $2.862 is holding as a pivot. The minor retracement zone at $2.890 to $2.922 has capped every push higher this week. $3.026 changes the trend. $2.753 reaffirms the downtrend and that level held once last week. Thursday’s data determines whether it has to hold again.
More Information in our Economic Calendar.