


Warm Forecasts Are Hitting the Entire Natural Gas Strip
Both winter strip natural gas futures contracts finished sharply lower on Friday. Additionally, for the week, November fell 15.28% and December dropped 9.92%. Surprisingly, the summer strip April futures contract also tumbled about 4.60%.
On Friday, November natural gas settled at $2.640, down $0.156 or -5.58%.
The catalyst behind the sell-off is the weather. Forecasters are now calling for above-average fall temperatures in the United States that could put a dent in heating demand. According to the Commodity Weather Group, above-average temperatures are expected to impact the Midwest and East until November 5.
Bearish long-term factors are also having an impact on the deferred summer strip April futures contract. This is because of the market’s expectations of a Super El Nino that is expected to bring warmer-than-normal temperatures to the Northern Hemisphere over the fall and winter. This could lead to lower demand and a larger-than-usual storage build at the end of winter.
Daily November Natural Gas Futures Technical Analysis
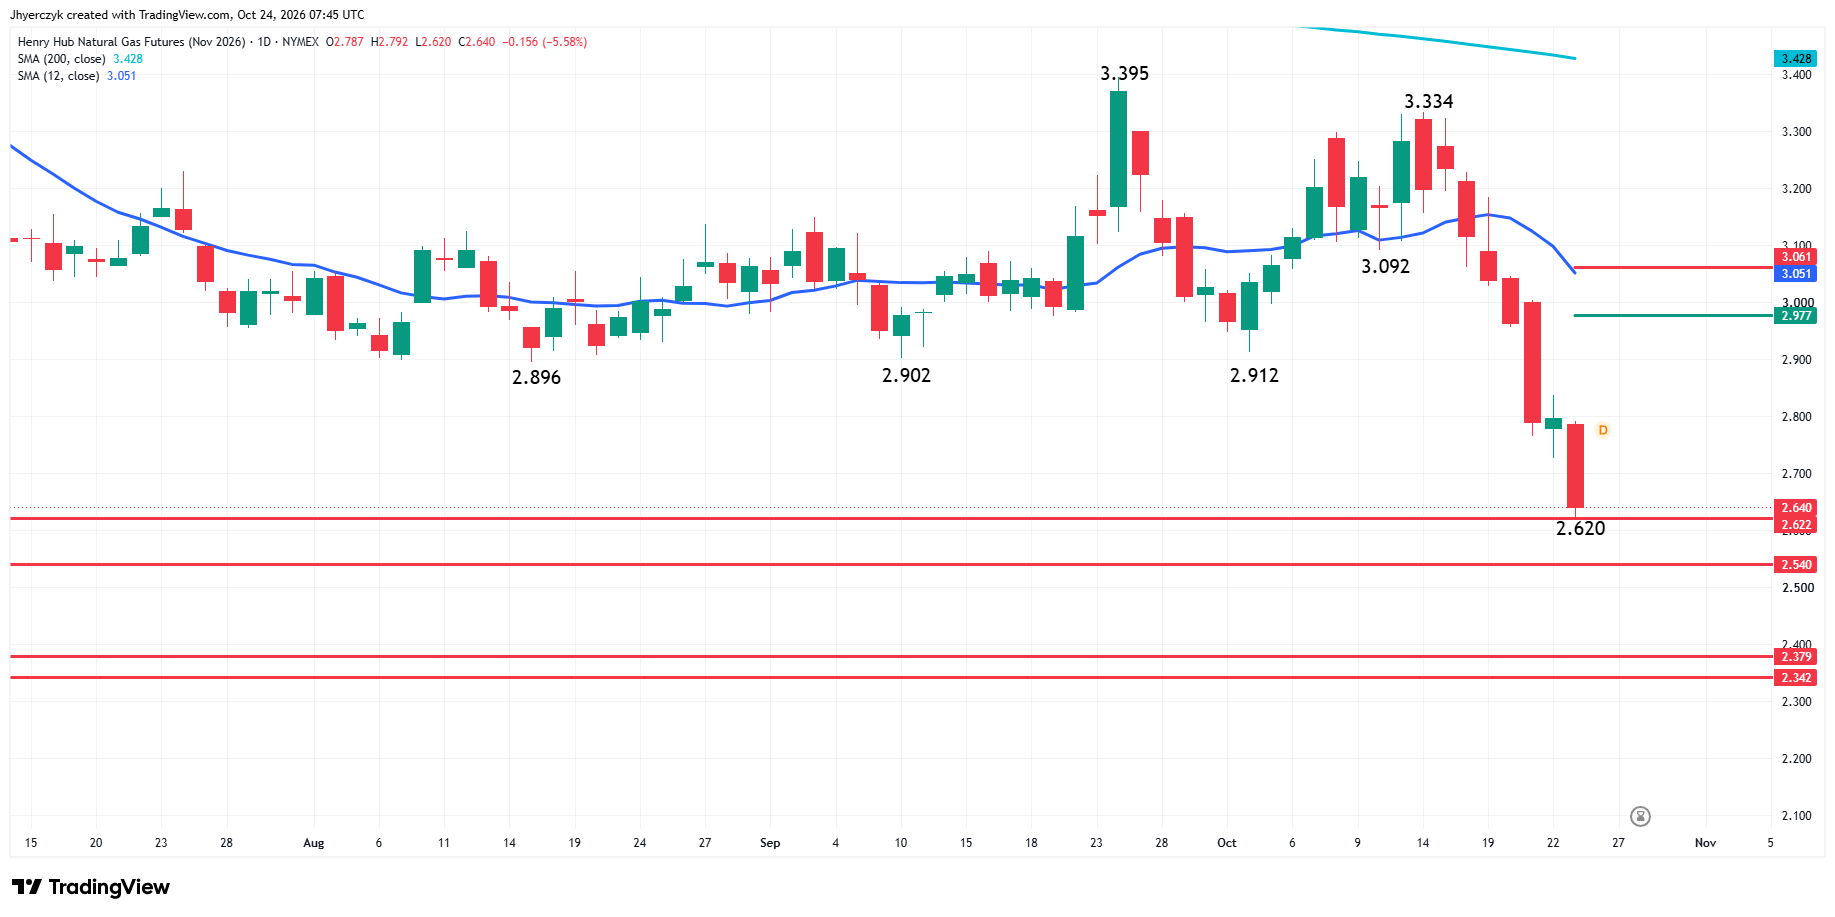
The main trend is down according to the daily swing chart. A trade through $2.620 will reaffirm the downtrend. The main trend will change to up if buyers can take out the swing top at $3.334.
The short-term range is $3.334 to $2.620. Its retracement zone at $2.977 to $3.061 is the nearest resistance. Inside this zone is 50-day moving average resistance at $3.051.
On the downside, multi-month support is $2.622, $2.540, $2.379 and $2.342. On Friday, the market pierced $2.622, stopped at $2.620 and closed at $2.640.
November Natural Gas futures are down seven sessions from the last swing top at $3.334. This puts the market inside the window of time for a potentially bullish closing price reversal bottom. If confirmed, this could trigger a two-to-three-day counter-trend rally and a rally equal to 50% to 61.8% of the downswing. As of Friday’s close, this area is $2.977 to $3.051.
A closing price reversal bottom is not a change in trend, but it often alleviates some of the downside pressure.
Natural Gas Price Forecast
Every new Natural Gas analysis as it publishes, today's technical signal and key levels, live price — on one page.
See all Natural Gas forecastsDaily December Natural Gas Futures Technical Analysis
December Natural gas futures have a similar pattern to the November futures contract because they are part of the same winter strip. This is something you see when you don’t trade the continuous natural gas chart. It makes trend following a lot easier because you aren’t dealing with all of the nuances of the Spring, Summer, Fall and Winter strips, combined into one contract.
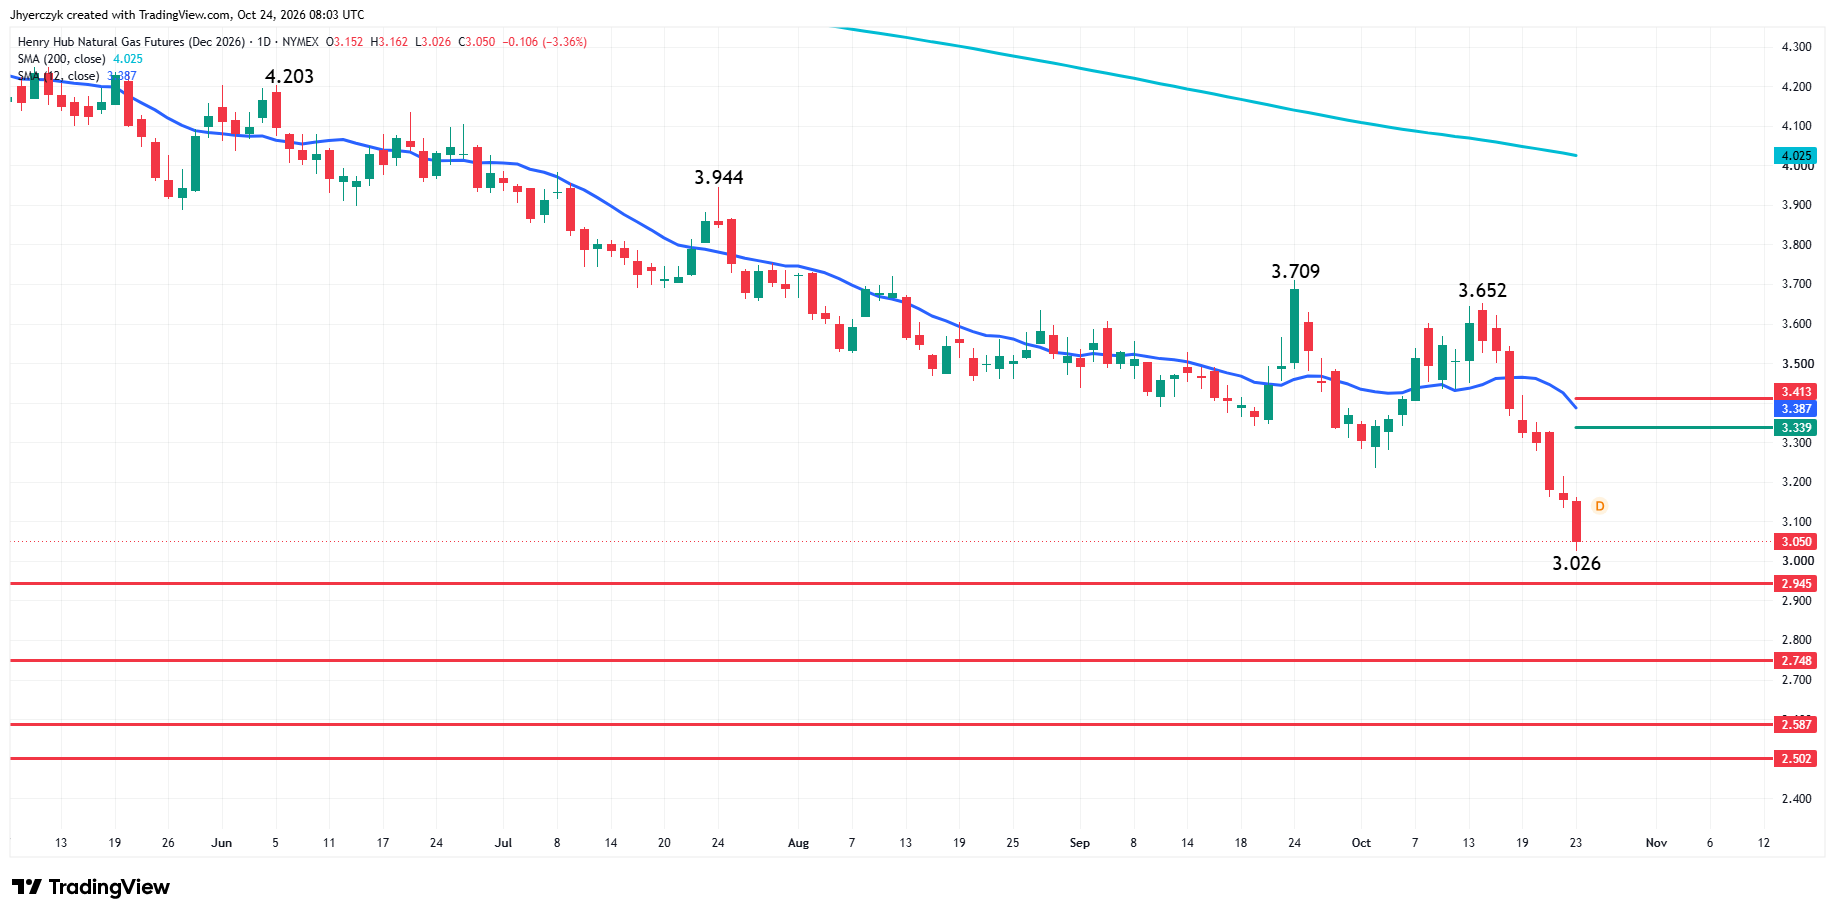
The main trend is down according to the daily swing chart. A trade through $3.026 will signal a resumption of the downtrend. The main trend will change to up on a breakout over the swing top at $3.652. The market is also trading on the bearish side of both the 50-day and 200-day moving averages.
The short-term range is $3.652 to $3.026. Its retracement zone resistance is $3.339 to $3.413. The 50-day moving average at 3.387 is inside this zone, doubling its importance.
Historical downside targets come in at $2.945, $2.748, $2.587 and $2.502.
Given the prolonged move down in terms of price and time, or $0.626 and seven days, the market is currently inside the window of time for a potentially bullish closing price reversal bottom. If confirmed, this won’t change the trend to up, but it could lead to a two-to-three-day counter-trend rally equal to 50% to 61.8% of the recent break from $3.652 to $3.026.
Daily April Natural Gas Technical Analysis
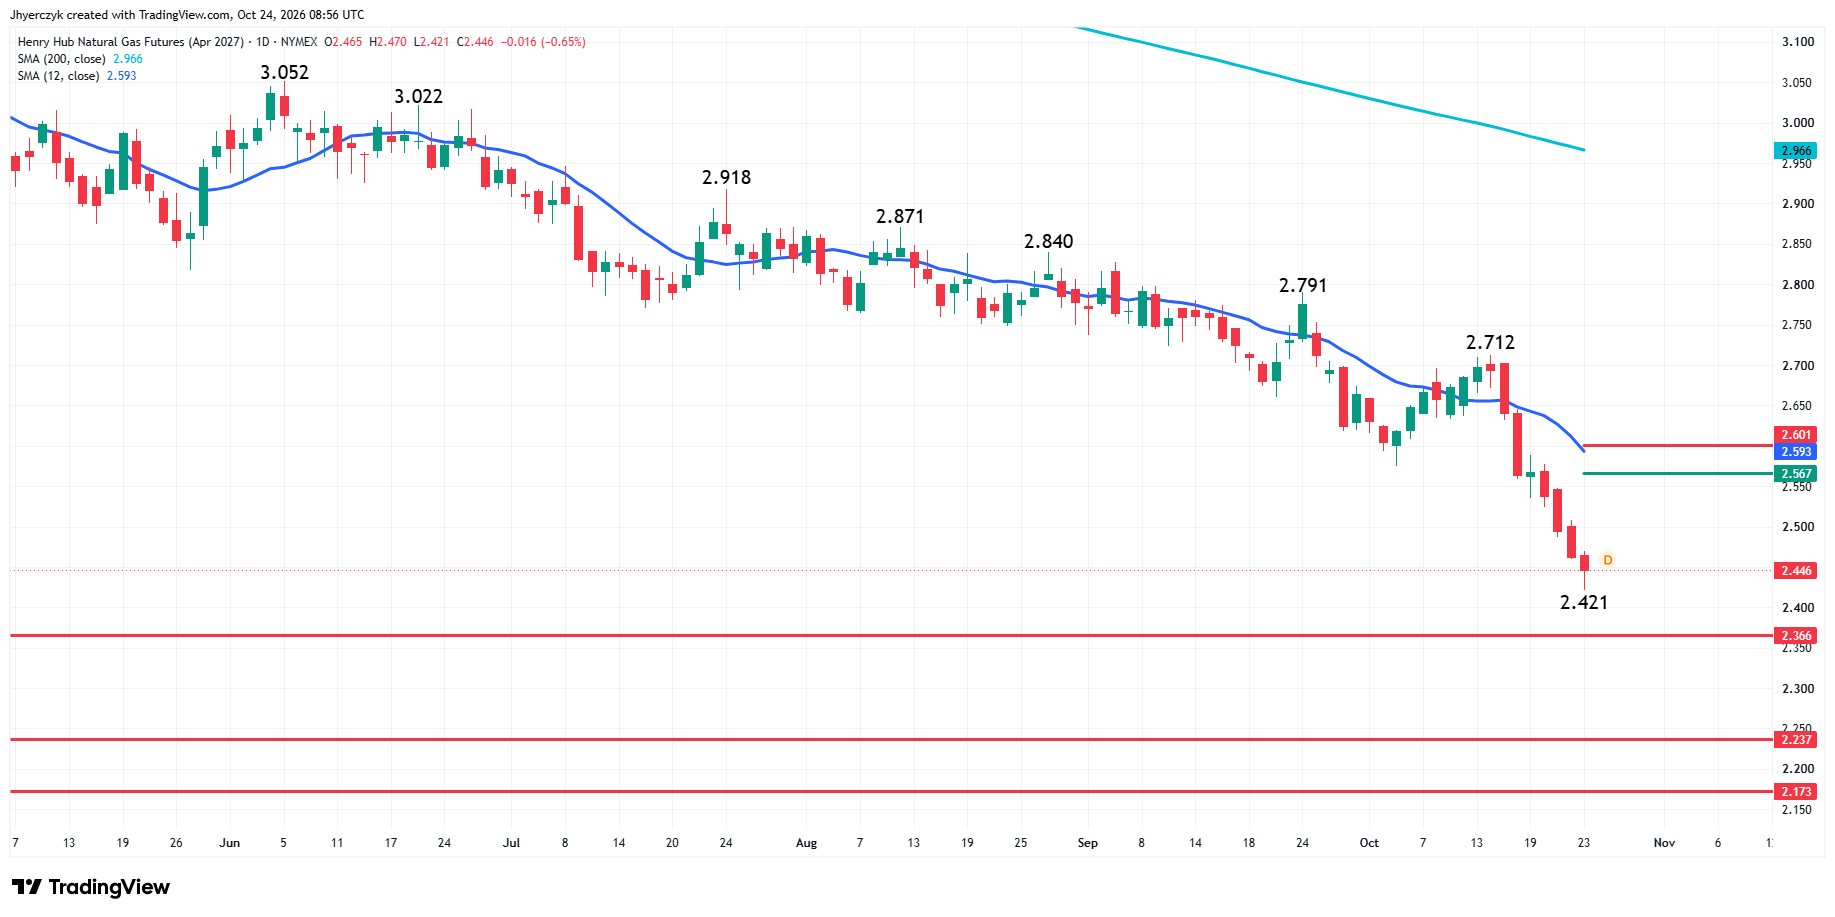
April natural gas is part of the summer strip, but like the winter strip November and December futures contracts, it too is in a downtrend. A trade through $3.421 will signal a resumption of the downtrend. The main trend will change to up on a trade through the last swing top at $2.712.
The short-term range is $2.712 to $2.421. Its retracement zone at $2.567 to $2.601 is the nearest resistance along with the 50-day moving average at $2.593.
The nearest downside target is the long-term bottom at $2.366. This is followed by $2.237 and $2.173.
What to Watch
The weather is the catalyst to watch until at least November 5.
As of the close, my bias for the November natural gas futures contract is to the downside. It is being driven by the downtrend on the swing chart and the trade on the weak side of the 50-day moving. My outlook will weaken some if a closing price reversal bottom forms and is confirmed by the subsequent price action.
For December natural gas, the downtrend on the swing chart and the prolonged move on the weak side of the 50-day moving average are driving my downside bias. A confirmed closing price reversal bottom will weigh on my outlook, but my bias isn’t likely to change unless the trend changes to up.
The bearish main swing chart and 50-day moving average chart patterns are driving my downside bias for the April natural gas futures contract. That won’t change until the trend changes to up. Due to the prolonged move down in terms of price and time, the market is inside the window of time for a potentially bullish closing price reversal bottom. If confirmed, it won’t change the trend, but could lead to a quick counter-trend rally into the retracement zone or 50-day moving average. This chart pattern will soften my bearish outlook but won’t erase it.
More Information in our Economic Calendar.