


Record Short Positions Set Up Volatile Natural Gas Trade
Nearby and deferred natural gas futures are edging higher early Tuesday in anticipation of colder U.S. temperatures in several key demand areas. Monday’s rally to a four-week high was primarily fueled by aggressive hedge fund short-covering. Hedge funds came into the week heavily short because of warmer winter expectations tied to the Super El Niño.
According to the Commodity Weather Group, forecasts are calling for cooler temperatures from the central U.S. to the East Coast until about November 20. A jump in U.S. natural gas exports also provided a spark, with LNG net flows to U.S. export terminals hitting a record 21.6 bcf/day on Saturday, according to BNEF.
The catalysts for the price launch are the weather and LNG demand, but the fuel for the rally is being supplied by heavily short hedge fund positions. According to the latest CFTC Commitment of Traders report, released Friday, large speculators added 14,124 short positions in the week ended November 3. The increase lifted their net-short position by 3,699 contracts to 258,863.
We’re looking for volatile conditions to continue for the next 10 trading sessions, or until a new 10- to 15-day forecast is released.
Daily December Natural Gas Futures Technical Analysis
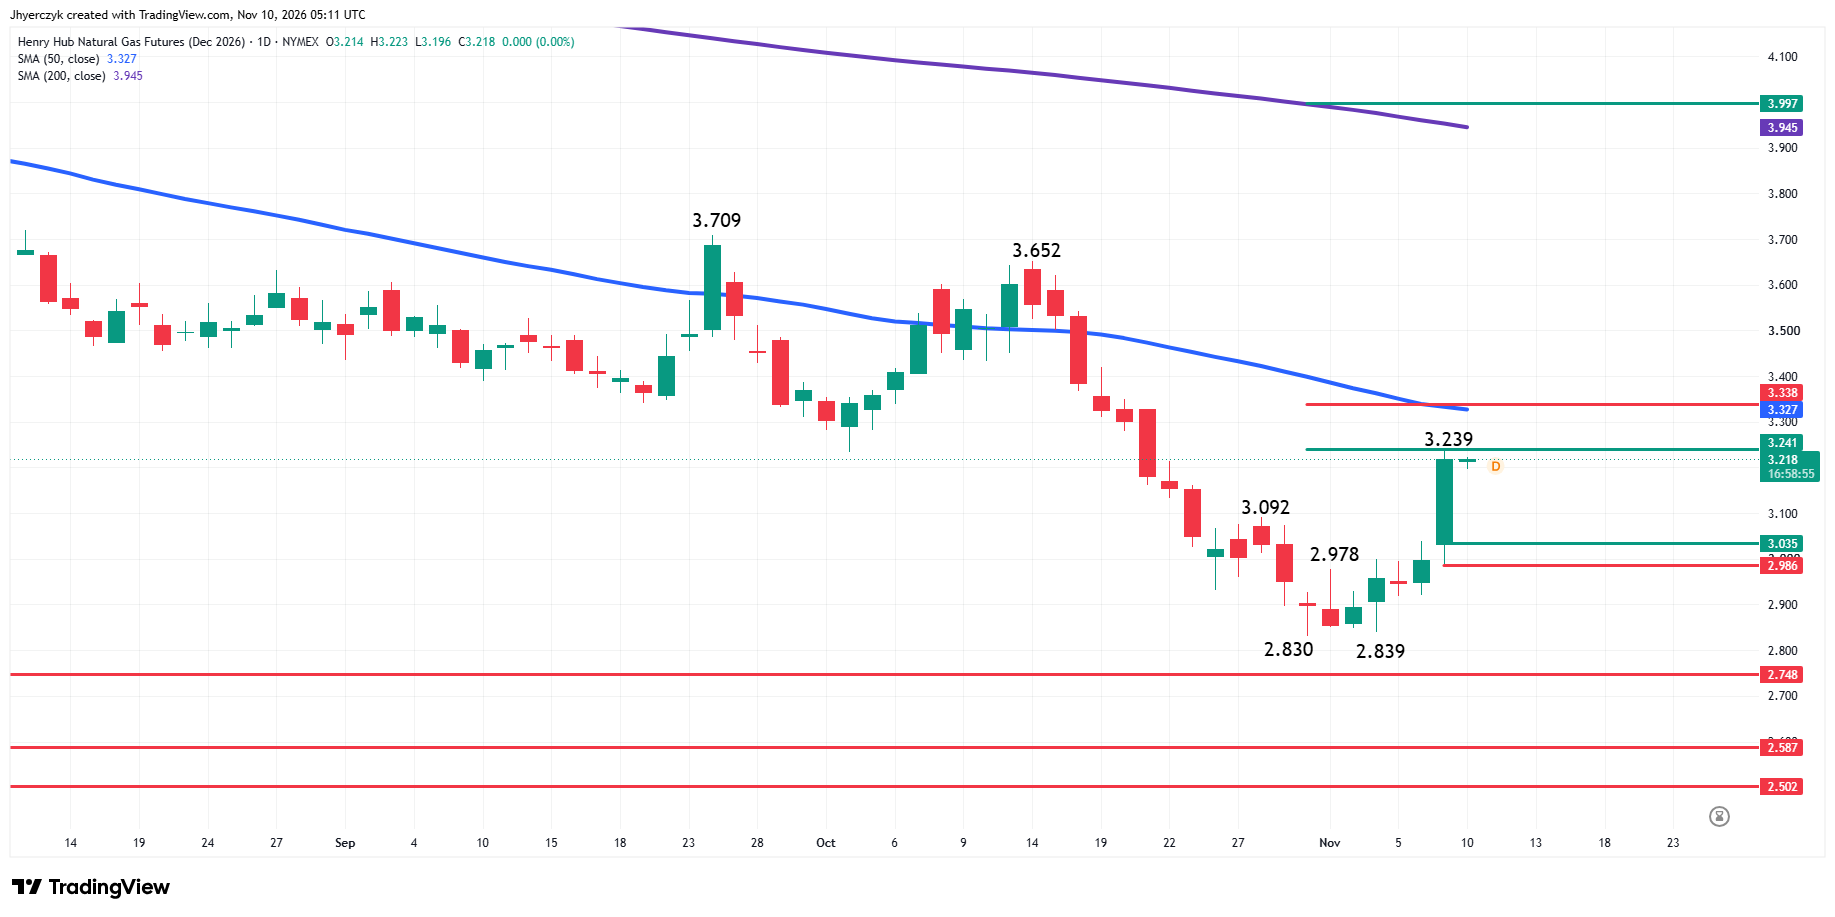
December natural gas futures surged on Monday, changing the main trend to up when it broke through the swing top at $3.092. A trade through $2.830 will change the main trend to down.
The long-term range is $5.164 to $2.830. Its retracement zone resistance target is $3.997 to $4.272. The intermediate range is $3.709 to $2.830. Its retracement zone resistance target is $3.241 to $3.338. The new short-term range is $2.830 to $3.239. Its retracement zone support target is $3.035 to $2.986.
The 50-day moving average is $3.327. It falls inside the intermediate retracement zone. It forms a resistance cluster with the 61.8% level at $3.338.
The 200-day moving average is $3.945. It is currently in front of the long-term resistance zone. It forms a loose resistance cluster with the 50% level at $3.997.
Natural Gas Price Forecast
Every new Natural Gas analysis as it publishes, today's technical signal and key levels, live price — on one page.
See all Natural Gas forecastsDaily April Natural Gas Futures Technical Analysis
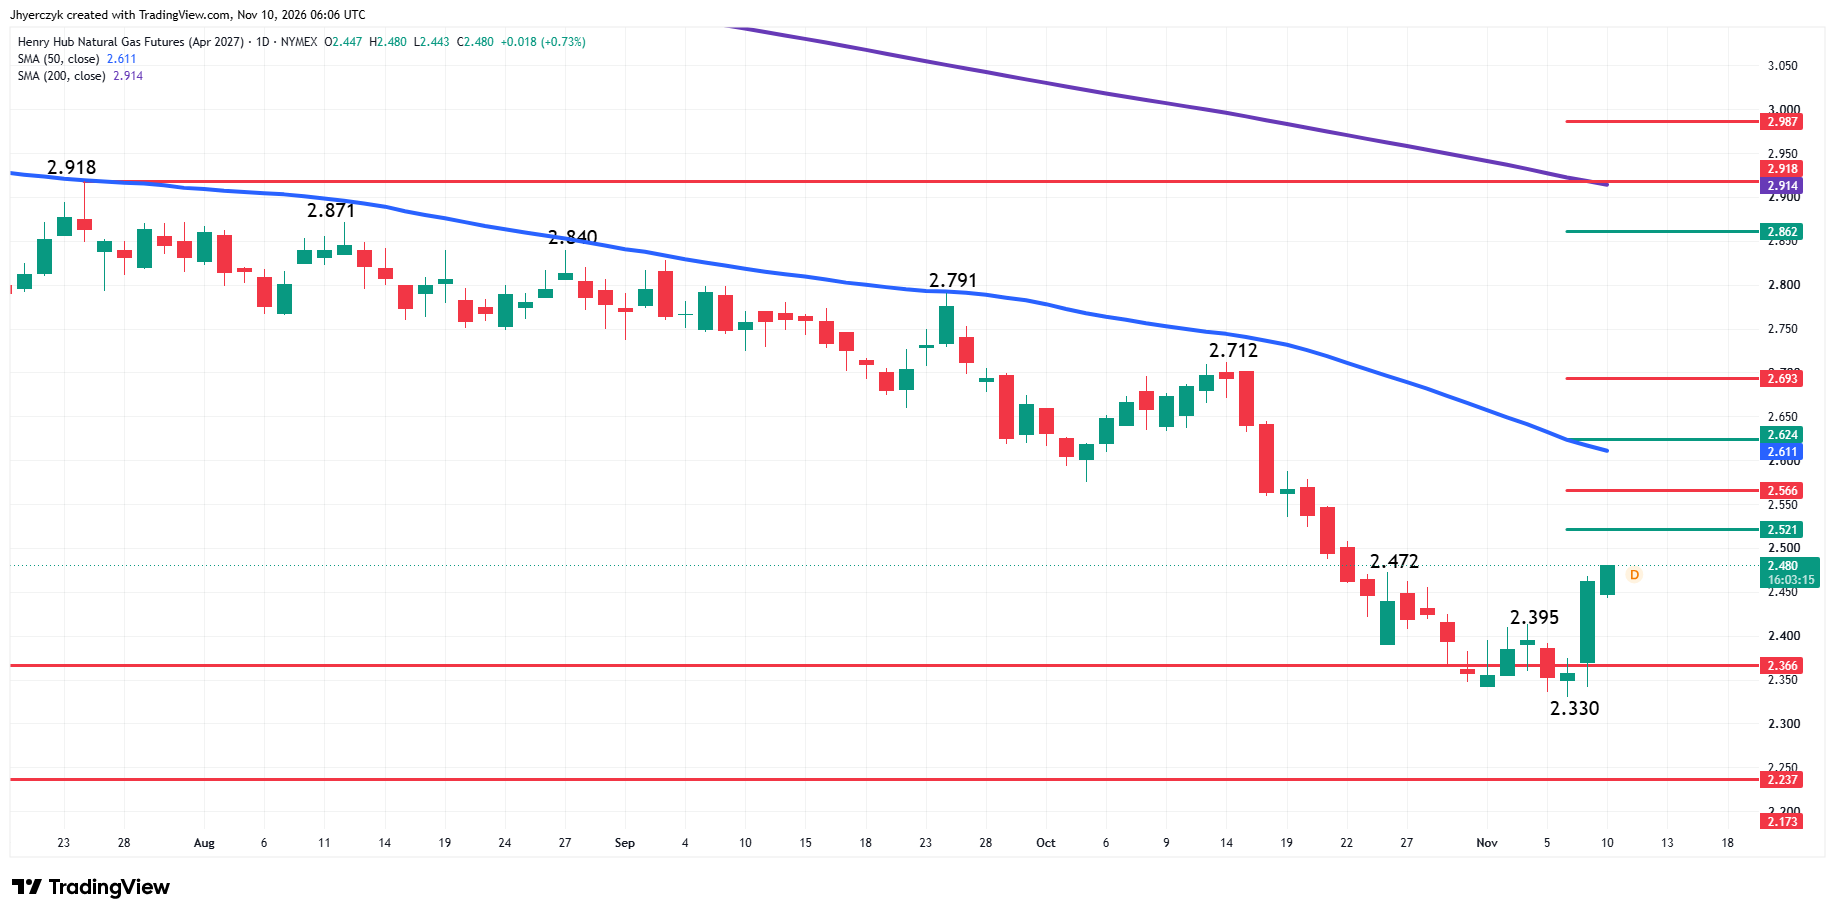
The main trend turned up for April natural gas futures on Monday when buyers took out the swing top at $2.395. A trade through $2.330 will change the main trend to down.
The short-term range is $2.712 to $2.330. Its retracement zone at $2.521 to $2.566 is the first upside target.
The intermediate range is $2.918 to $2.330. Its retracement zone target is $2.624 to $2.693. 50-day moving average resistance is at $2.611, just in front of the 50% level.
The long-term retracement zone target is $2.862 to $2.987. The 200-day moving average at $2.914 and a main top at $2.918 are inside the zone.
What to Watch
December Natural Gas Futures
My bias changed to the upside on Monday when buyers took out $3.092, changing the main trend to up. Early Tuesday, I see buyers facing potential resistance at the intermediate 50% level at $3.241. Monday’s high at $3.239 fell a little short of an exact test.
Overcoming $3.241 will strengthen my outlook and could create the upside momentum needed to challenge the resistance cluster formed by the 50-day moving average at $3.327 and the 61.8% level at $3.338. Sellers could come in to stop the rally, but a breakout over $3.338 could trigger an acceleration to the upside with a pair of main tops at $3.652 and $3.709 the next targets.
A failure to sustain a rally over $3.241 will be a sign of weakness. This would indicate that Monday’s rally was likely fueled by short-covering rather than aggressive buying. If momentum shifts to the downside, we could see a pullback into the short-term retracement zone at $3.035 to $2.986.
A successful test of the short-term retracement zone will be critical to the developing rally. With the main trend up, buyers are likely to show up on a break into the retracement area in the hopes of forming a potentially bullish secondary higher bottom. If $2.986 fails as support, then look for a near-term retest of the $2.839 to $2.830 support.
Essentially, what the market is asking traders is do you want natural gas bad enough to chase offers, or are you willing to wait for a pullback and passively bid at your price.
April Natural Gas Futures
My bias changed to bullish on Monday when the trend changed to up on the trade through $2.395. If the upside momentum continues then look for a surge into the retracement zone at $2.521 to $2.566. Overtaking this area will put the 50-day moving average at $2.611 and the intermediate retracement zone at $2.624 to $2.693 on the radar.
A failure at $2.521 will signal that the buying is weak and the selling may be getting a little stronger. This could lead to a 50% retracement of the first leg up from $2.330. Right now that level is about $2.405. The first leg up is usually short-covering. What we’re hoping to see on any retracement is the formation of a potentially bullish secondary bottom. This will indicate that new buyers have entered the move.
More Information in our Economic Calendar.