



Weather and Storage Keep Pressure on Natural Gas
December natural gas futures opened the week lower, extending the late selling pressure from last week. Traders continue to weigh weather and demand concerns, storage levels, and supply and feedgas factors.
Natural gas hit its high for the week last Wednesday when the weather services took cold out of the forecasts for after November 20 and put in warmer weather. Spot buyers had rushed in earlier in the week to stock up for the first big cold front in the East, but that rush is over.
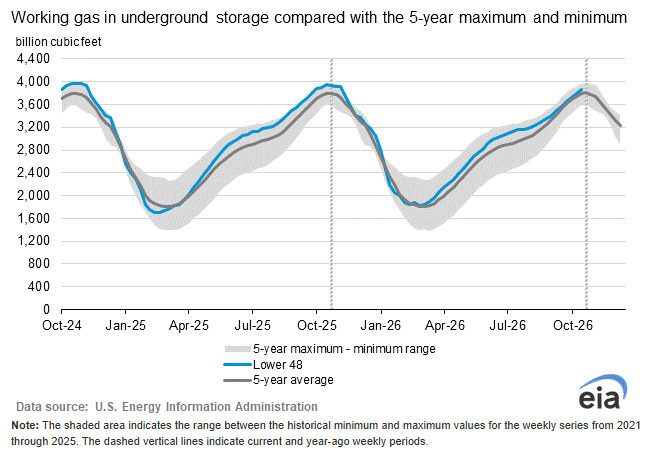
With natural gas just about to start the winter heating season, traders are likely to remain on edge for the next four-to-five months for the next cold snap. However, they are not likely to lose sight of the fact that the amount of gas in storage could make it harder to sustain rallies. Even though last week’s U.S. Energy Information Administration (EIA) report showed a smaller-than-expected amount of gas added to storage (61 billion cubic feet for the week ending November 6), there is still a lot of gas stored overall as winter approaches.
Finally, this week natural gas could continue to garner some support from LNG exports as demand is sitting close to near-record highs. However, these gains may be offset by high domestic production and last week’s forecasts calling for milder weather in traditionally high-demand areas. Last week’s price action and this week’s early weakness indicate that prices may struggle to sustain rallies, giving sellers an early advantage this week.
Weekly December Natural Gas Futures Technical Analysis
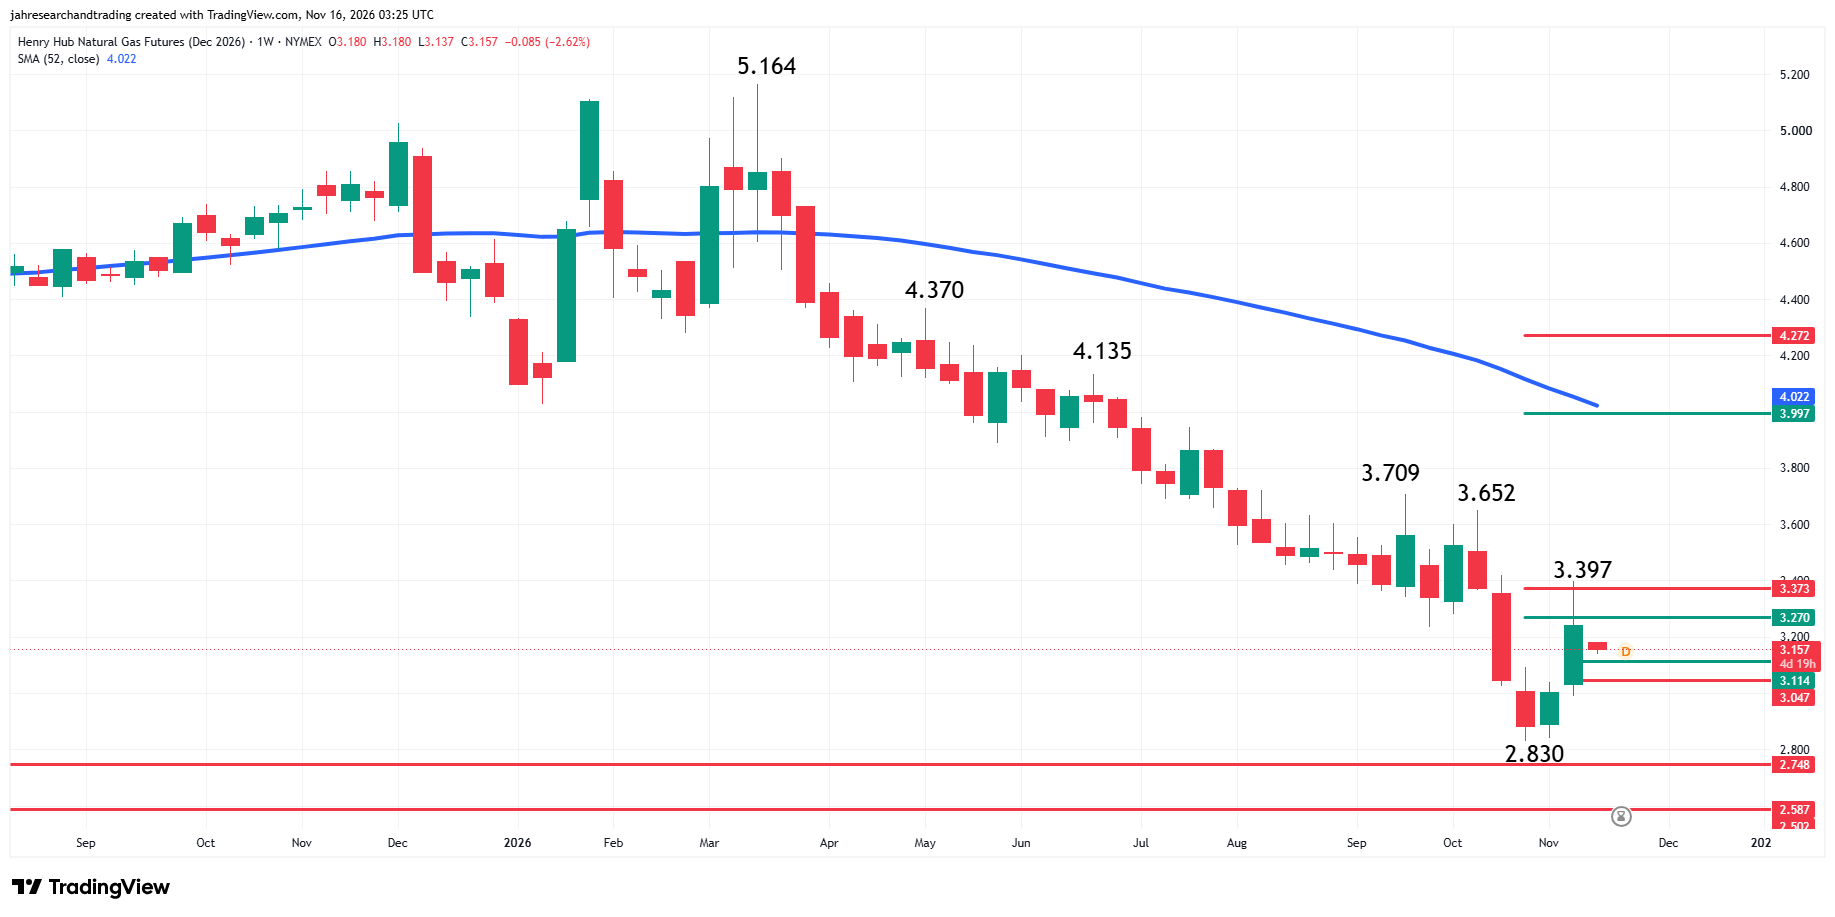
December natural gas futures are trading lower at the start of the new week. The main trend is down according to the weekly swing chart. A trade through $3.652 will change the main trend to up. Taking out $2.830 will signal a resumption of the downtrend.
The long-term range is $5.164 to $2.830. Its 50% to 61.8% retracement zone at $3.997 to $4.272 is a potential upside target. Inside this zone is the 52-week moving average at $4.022.
The short-term range is $3.709 to $2.830. Its retracement zone resistance is $3.270 to $3.373. Traders broke above this area, but the rally stalled at $3.397 and sellers pushed prices below the zone into last week’s close at $3.242.
The new minor range is $2.830 to $3.397. Its retracement zone at $3.114 to $3.047 is the next downside target. Trader reaction to this area is likely to set the early tone this week.
Natural Gas Price Forecast
Every new Natural Gas analysis as it publishes, today's technical signal and key levels, live price — on one page.
See all Natural Gas forecastsWeekly January Natural Gas Futures Technical Analysis
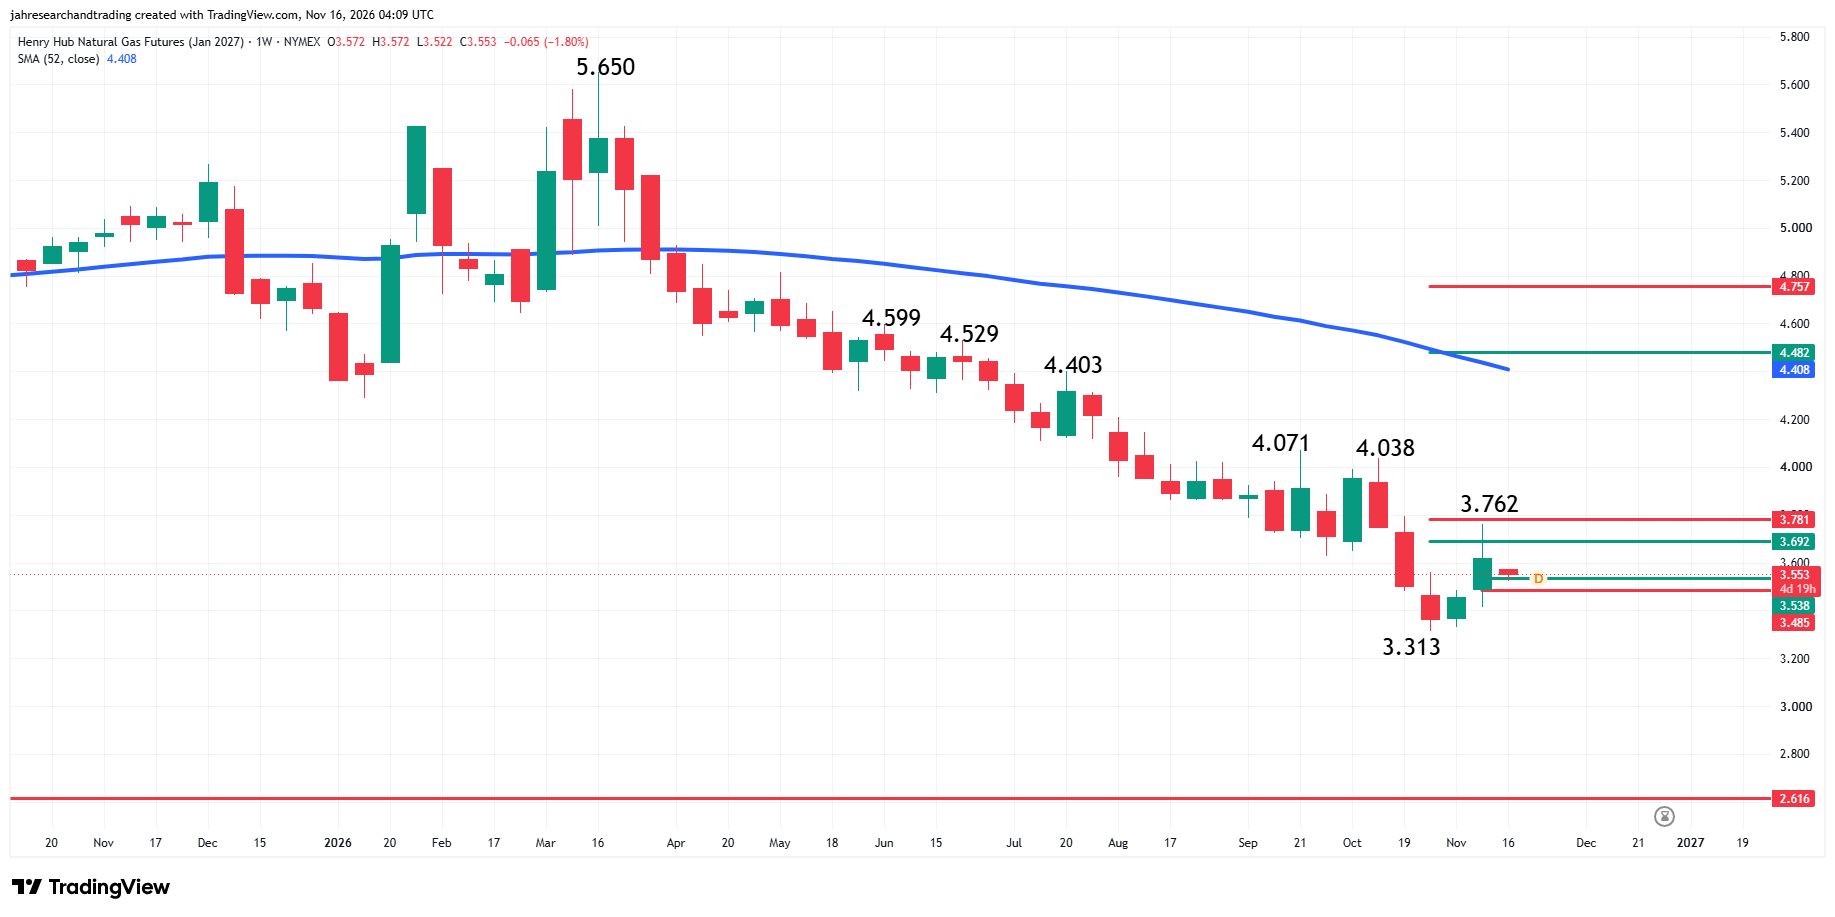
January natural gas futures are lower early Monday. The main trend is down according to the weekly swing chart. A trade through $4.038 will change the main trend to up. Taking out $4.071 will reaffirm the move. A trade through the main swing bottom at $3.313 will signal a resumption of the downtrend.
The long-term range is $5.650 to $3.313. Its retracement zone at $4.482 to $4.757 is the major resistance. Before buyers can reach this area, however, they will face headwinds at the 52-week moving average at $4.408.
The short-term range is $4.071 to $3.313. Its retracement zone at $3.692 to $3.781 is resistance. This area stopped the rally at $3.762 last week.
The minor range is $3.313 to $3.762. Its retracement zone at $3.538 to $3.485 is currently being tested. Trader reaction to this area is likely to set the tone early this week. Aggressive counter-trend buyers may try to establish a secondary higher bottom in this area in the hopes of it developing into an eventual change in trend.
Sellers are going to try to drive the market through the 61.8% level at $3.485. They will also try to drive the market through the main bottom at $3.313 in an effort to resume the downtrend.
What to Watch
December Natural Gas Futures
Downside pressure from the 52-week moving average at $4.022, a long-term 50% level at $3.997 and the short-term retracement zone at $3.270 to $3.373 are all supporting my downside bias at the start of the week. Mechanically, the downtrend on the weekly swing chart, led by the series of lower tops and lower bottoms, is exerting the most pressure.
Early in the week, I’ll be watching trader reaction to the minor retracement zone at $3.114 to $3.047 to dictate the strength of my conviction.
If buyers defend the 50% level at $3.114, this could signal the presence of counter-trend buyers. This will weaken my outlook. The next key area I’ll be watching is $3.270 to $3.373. Overtaking this area will also weaken my conviction, causing me to reconsider shifting my bias to the upside if buyers take out last week’s high at $3.397 with conviction.
On the downside, if the 61.8% level at $3.047 fails as support, natural gas could plunge toward the main swing bottom at $2.830, strengthening my conviction.
January Natural Gas Futures
My bias is to the downside at the start of the week. My outlook will be supported if sellers continue to defend the short-term retracement zone at $3.692 to $3.781. Overtaking the upper or 61.8% level could shift the momentum to the upside, which may influence me enough to change my bias to the upside.
Holding the minor retracement zone at $3.538 to $3.485 could also impact my bearish bias, especially if a secondary higher bottom is formed on the daily chart. However, if $3.485 is taken out with conviction then I’ll remain bearish with $3.313 my downside target.
More Information in our Economic Calendar.