


Warm Weather Keeps the Bearish Case Intact
Natural gas futures are edging higher early Tuesday after testing a multi-month low the previous session. Prices have plunged in the past week and a half due to forecasts for above-average U.S. fall temperatures with some analysts calling for this round to last another two weeks. That kind of news means a drop in natural gas heating demand will follow.
EBW Analytics Group said on Monday that “above-average temperatures are expected across the eastern two-thirds of the US through November 9.”
Adding to the short-term bearishness is the weaker longer-term outlook. The deferred futures contracts’ performance, starting with the summer strip in April, is showing that the Super El Niño will bring warmer-than-normal temperatures to the Northern Hemisphere this fall and winter, reducing heating demand for nat-gas.
Additionally, according to The Commodity Weather Group, November will be the third-warmest on record dating back to 1950.
Storage and Production Keep Supplies Adequate
The current supply and demand situation also supports lower prices. Production is up 5.3% this year, and demand is down 2.5% year over year, according to BNEF. However, the bearishness is being offset a little by a jump in U.S. LNG demand. As of last Thursday, net flows to U.S. LNG export terminals were at 20.6 bcf/day, up 4.7%, according to BNEF.
Prices have been under pressure and gains have been capped since about August 11 after the U.S. Energy Information Administration (EIA) projected that natural gas storage level could reach 3,985 bcf at the end of October. That’s a big number and it represents the highest point since 2016 and at least 5% above the five-year average. Just a month later, it raised its dry gas production estimate to 116.0 bcf/day from 115.3 bcf/day.
The weekly EIA reports haven’t offered much to celebrate either. As of October 16, natural gas inventories were down 4.3% year over year, but 1.0% above their 5-year seasonal average. These numbers are signaling adequate natural gas supplies. Meanwhile, there are signs that demand from Europe will continue.
Currently, storage in Europe was 75% full versus the 5-year seasonal average of 90% full for this time of year, according to ACER.
Rollover Could Lift the Nearby Contract
Looking ahead, we’re anticipating a little strength in the nearby contract after the rollover from November to December, but we may not see the same move in the deferred futures contracts. This is because the deferred contracts are still pricing in an unusually warm winter across high-demand heating markets. But the nearby contract is likely to continue to face more volatile weather patterns. Currently, the winter strip is at its lowest level since 2021.
Natural Gas Price Forecast
Every new Natural Gas analysis as it publishes, today's technical signal and key levels, live price — on one page.
See all Natural Gas forecastsDaily December Natural Gas Futures Technical Analysis
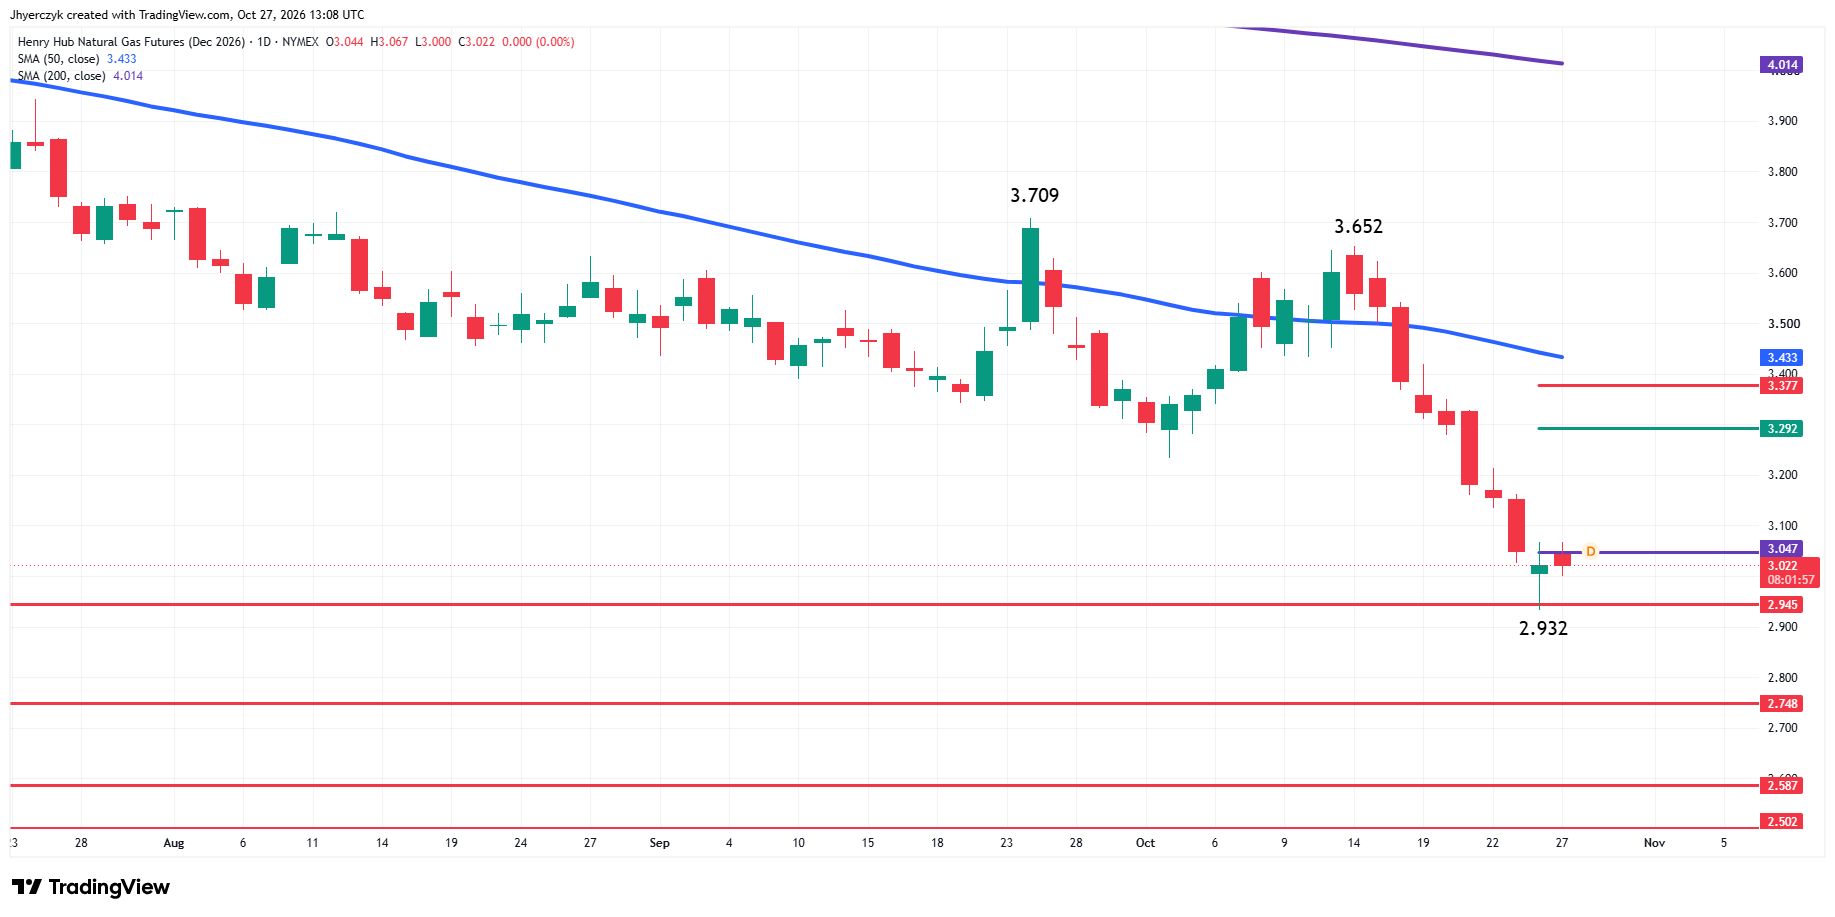
December Natural Gas futures reaffirmed the current downtrend when it took out a multi-month low at $2.945 on Monday. A trade through $3.652 will change the main trend to up.
The first objective was hit at $2.945 but buyers came in at $2.932, pushing prices back above it. Persistent selling pressure throughout the week through $2.945 will put the next downside target at $2.748 on the radar.
We didn’t quite get a closing price reversal bottom on the daily chart, but if the short-covering does continue then we could build a case for a rally into the retracement zone at $3.292 to $3.377, followed by the 50-day moving average at $3.433 over the near term.
The number we’ll be watching all week is $3.047. This is last week’s close. Since we already had the lower-low on the weekly chart, a close on Friday above $3.047 will produce a weekly closing price reversal bottom. This won’t change the main trend to up, but if confirmed, it could lead to the start of a 2-to-3-week counter-trend rally.
Daily April Natural Gas Futures Technical Analysis
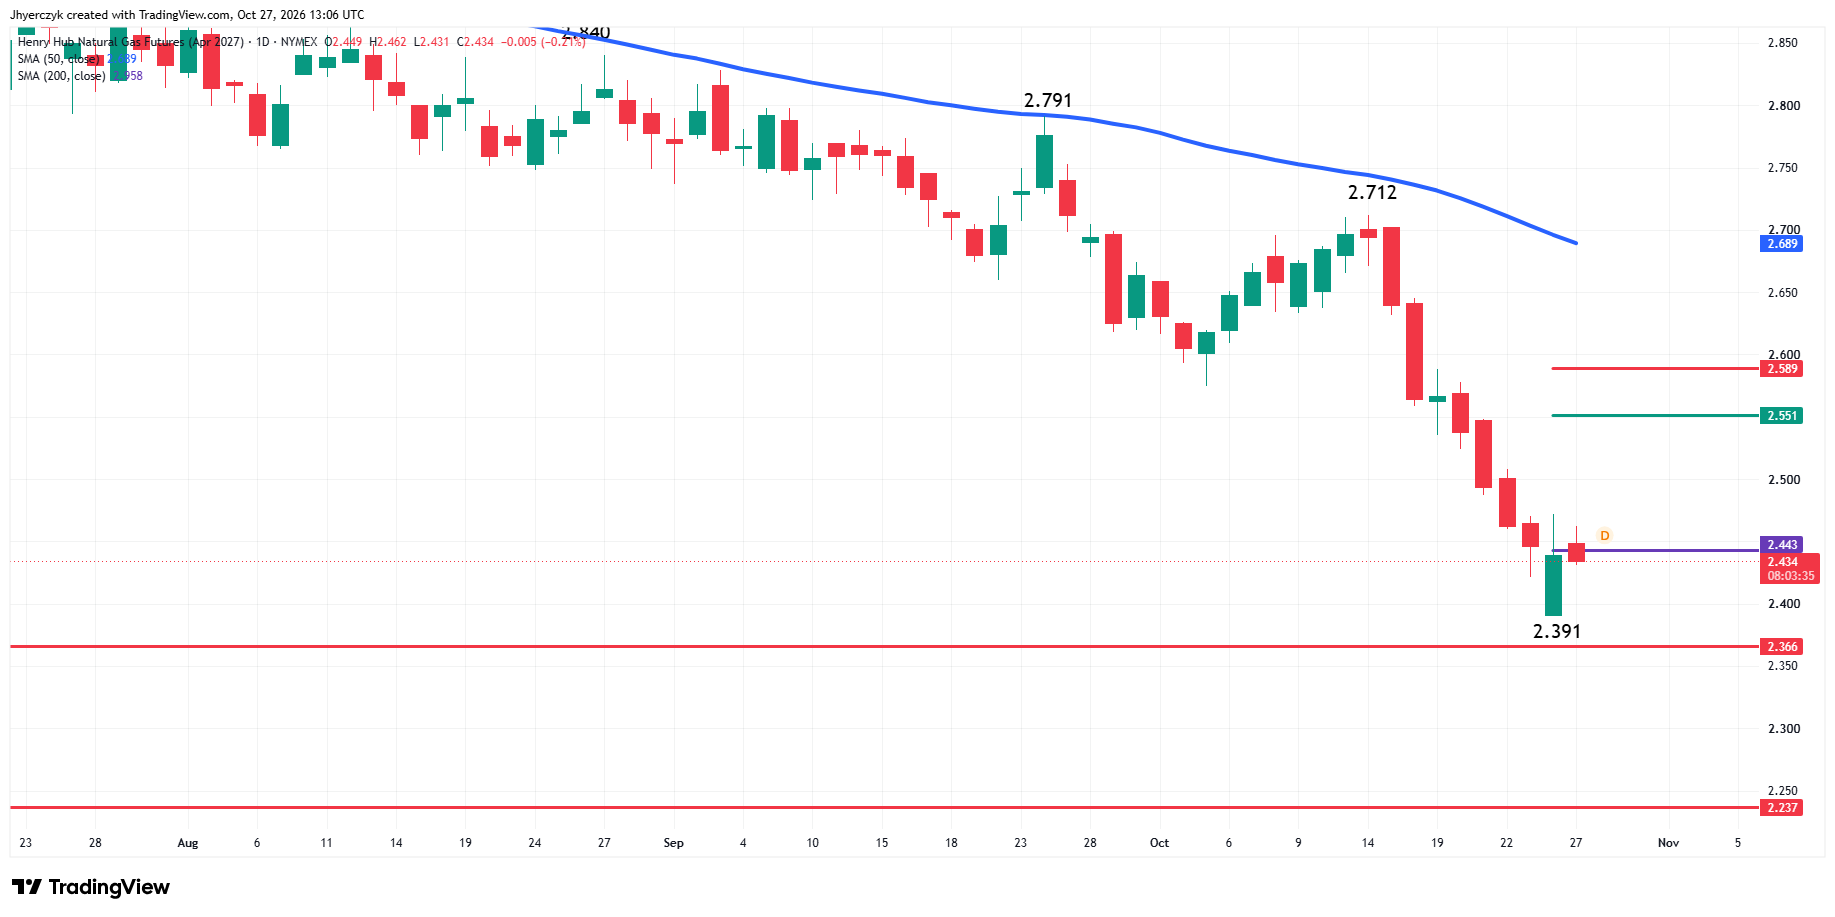
The summer strip April natural gas futures contract is also in a downtrend. A trade through the main top at $2.712 will change the main trend to up. Trades through previous swing bottoms at $2.366, $2.237 and $2.173 will reaffirm the downtrend.
Last week’s close at $2.443 is the number to watch this week. Given the earlier lower-low, a close above $2.443 will form a closing price reversal bottom.
What to Watch
December Natural Gas Futures
My bias leans to the downside because the main swing indicator is down and the market is well below the 50-day moving average at $3.433 that is also a trend indicator as well as resistance.
A sustained move under $2.945 would put $2.748 on the radar.
Overcoming last week’s close at $3.047 will weaken my bearish outlook. Closing over $3.047 will not change the trend to up, but it could make the market vulnerable to a rally to at least $3.292.
April Natural Gas Futures
I’m starting the week bearish because of the downtrend on the weekly and daily swing charts and the direction of the 50-day moving average at $2.689. My outlook will weaken if the market closes the week above $2.443. A confirmed closing price reversal bottom could fuel a 2-to-3-week counter-trend rally to $2.552 to $2.590.
More Information in our Economic Calendar.