



Warm Weather Keeps Demand Outlook Bearish
Nearby and deferred natural gas futures are trading a little better on Wednesday as traders continue to absorb last week’s steep sell-off. The current weather forecasts are still bearish, but strong LNG feedgas demand may be providing some support. Providing a lid on prices may be increased supply as producers ramp up ahead of winter.
NatGasWeather updated their daily and weekly forecasts. The service is calling for a bearish pattern over the next 15 days with most of the U.S. high-demand areas expected to experience “near to warmer than normal temperatures.” From October 28 to November 3, traders are being advised of light demand.
After last week’s steep sell-off and Monday’s gap lower opening, prices have stabilized for both nearby and deferred futures contracts. A small shift to cooler temperatures by the Commodity Weather Group late Tuesday provided some support, but their longer-term forecast remained unchanged. For longer-term traders, predictions of a Super El Niño over the winter indicate warmer-than-normal temperatures across the Northern Hemisphere could lead to lower demand. This could put storage levels at high levels before next year’s summer cooling season.
LNG Flows Offer Modest Support
Higher LNG flows were also a little supportive. According to BNEF, estimated LNG net flows to U.S. LNG export terminals Tuesday were 20.8 Bcf/d, up 7.3% from the prior week.
Storage and November Expiration Remain in Focus
On Thursday, the EIA will report the weekly storage numbers. The report is expected to show a build of 68 Bcf for the week ending October 23. The current amount of gas in storage is 3644 Bcf. The EIA is forecasting about 3850 Bcf at the end of October, about 2% above the five-year average.
Even with the weather driving a clear downtrend, traders should be aware of potentially volatile price action due to the expiration of November 2026 futures at the close.
Daily December Natural Gas Futures Technical Analysis
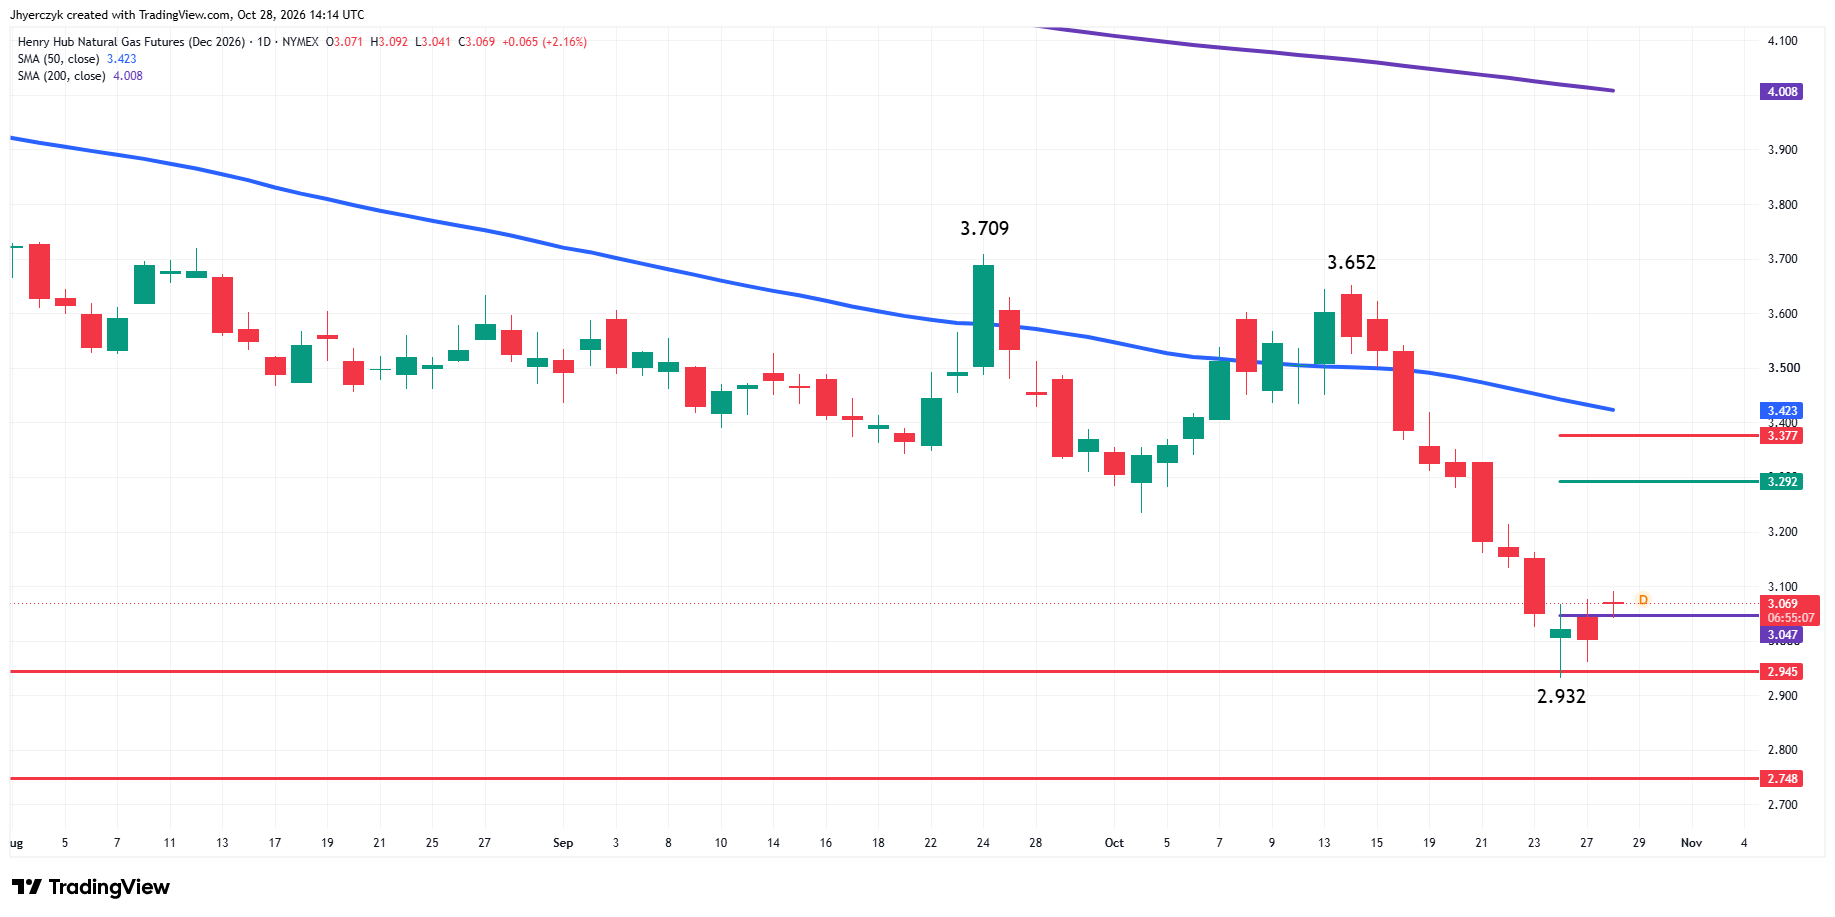
December natural gas futures are edging higher on Wednesday. The market is trading higher for the week after hitting a multi-month low earlier in the week. The trend isn’t close to turning up so this price action likely represents profit-taking by momentum traders, following a prolonged move down in terms of price and time.
Natural Gas Price Forecast
Every new Natural Gas analysis as it publishes, today's technical signal and key levels, live price — on one page.
See all Natural Gas forecastsThe main trend is down according to the daily swing chart. A trade through the new main bottom at $2.932 will signal a resumption of the downtrend. The main trend will change to up on a trade through the swing top at $3.652.
The short-term range is $3.652 to $2.932. Its retracement zone at $3.292 to $3.377 is a potential upside target and resistance area.
The 50-day moving average at $3.423 is guiding the trend and likely to provide resistance.
Another number to watch is last week’s close at $3.047. After Monday’s lower-low, a close above this level on Friday will produce a weekly closing price reversal bottom. This will not change the main trend, but it could fuel a 2-to-3-week counter-trend rally.
Daily April Natural Gas Futures Technical Analysis
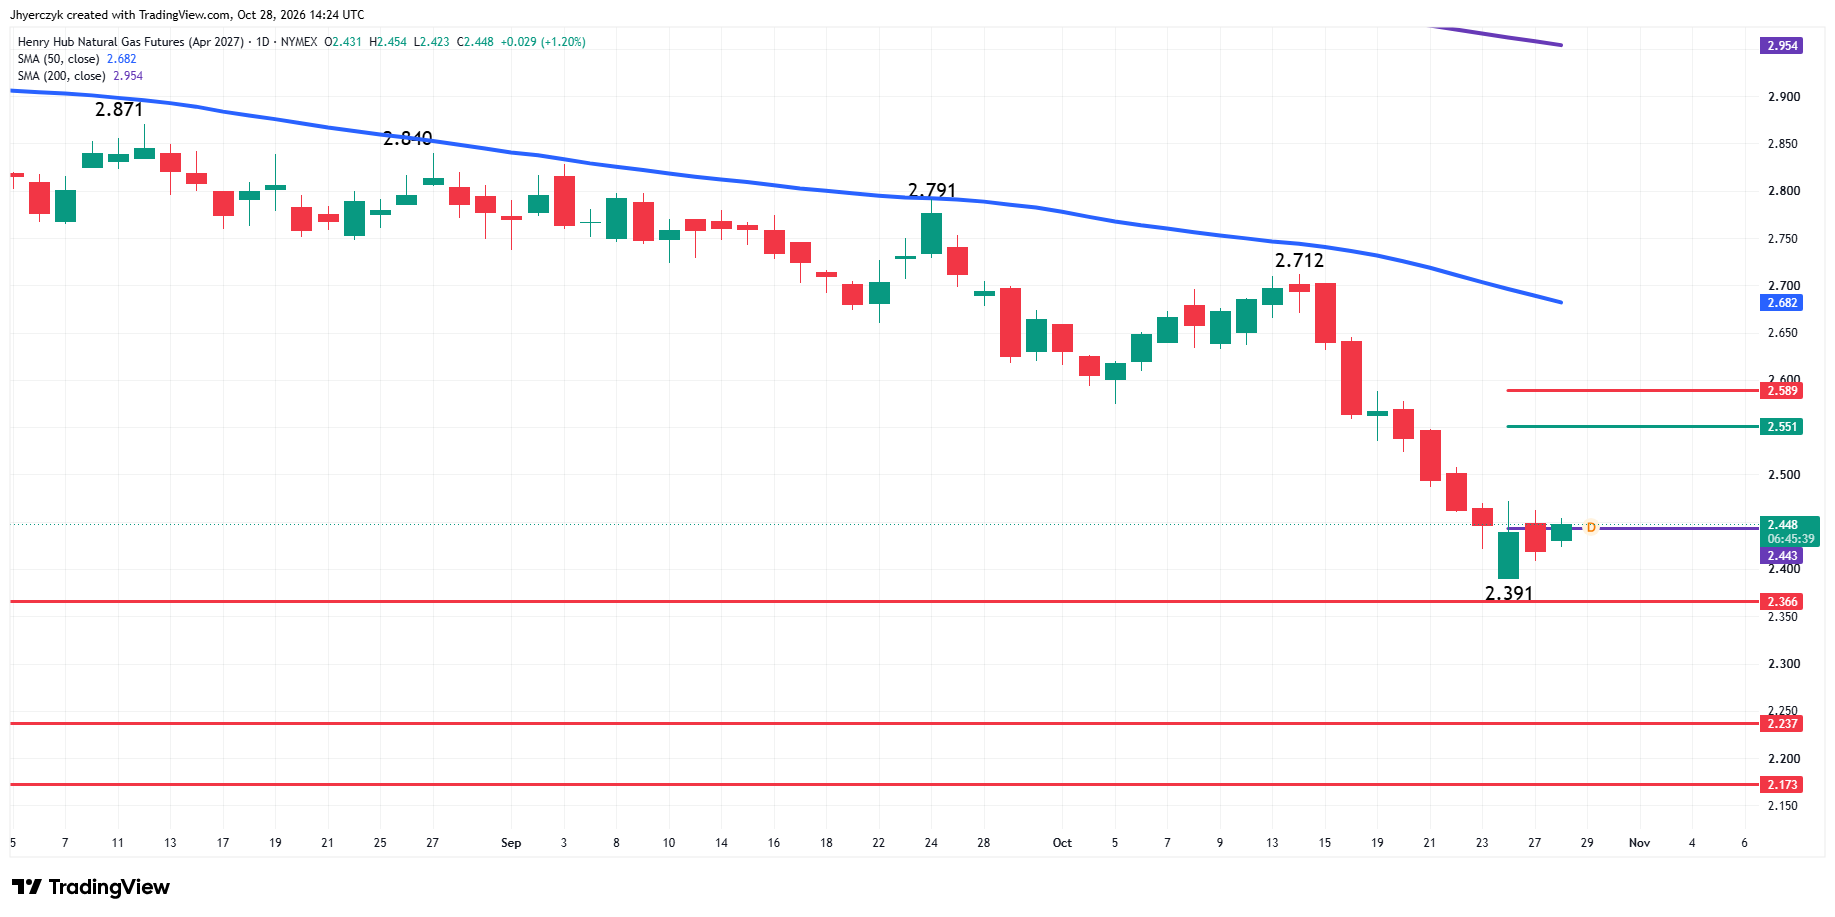
Deferred summer-strip April natural gas futures are slightly higher on Wednesday. The main trend is down according to the daily swing chart. A trade through $2.391 will signal a resumption of the downtrend. The main trend will change to up if buyers can take out the swing top at $2.712.
The short-term range is $2.712 to $2.391. Its retracement zone at $2.551 to $2.589 is the nearest upside target area. This is followed by the 50-day moving average at $2.682.
Another key level to keep an eye on is last week’s close at $2.443. It could act like a pivot on the daily chart. On the weekly chart, a close over this price will produce a potentially bullish closing price reversal bottom. If confirmed, it could even trigger the start of a 2-to-3-week counter-trend rally. It could take on added importance as we approach the end of the week.
What to Watch
Daily December Natural Gas Futures
My bias is to the short side because the main trend is down, but it’s probably not a good idea to initiate new shorts when the out or exit isn’t clear. So the best position is neutral until we can see where the short-covering rally stops.
On the downside, a trade through $2.932 could lead to a steep break into the next long-term support at $2.748. On the upside, the best target zone resistance is $3.292 to $3.377 with the 50-day moving average acting as a major cap.
Daily April Natural Gas Futures
My bias is to the downside, but I recognize the possibility of a weekly closing price reversal bottom and the exposure up to $2.551 to $2.589. On the downside, a sustained move under $2.366 could put the market in an extremely weak position.
The early price action this week suggests that bearish traders haven’t decided whether to continue to sell weakness or wait for a rally.
More Information in our Economic Calendar.