


Natural Gas Holds Weekly Gain as Traders Await Weekend Forecasts
Nearby December natural gas futures are lower late in the session on Friday, but remained in a position to post weekly gains. The week started with traders pricing in a forecast calling for cooler temperatures until November 20. The subsequent rally peaked on Wednesday after the forecasts indicated a little less cold and a little more warmth.
Today’s price action suggests traders are holding out for the weekend to see how cold it gets in key demand areas in the East and whether the forecasts shift. Any major changes to the forecast could create volatile trading conditions on Monday.
In addition to the weather, the market is garnering strong support from a jump in LNG feedgas flows. Traders are also reacting to today’s EIA weekly storage report. It fell short of the estimates, but it was well above the five-year average, which may have weighed on today’s price action.
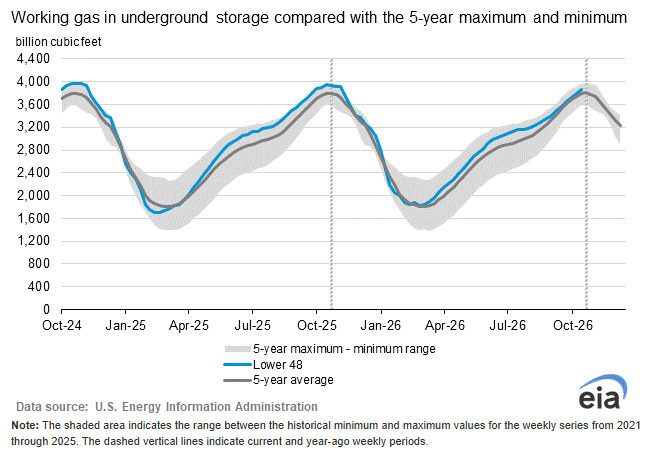
On Friday, the EIA reported an injection of 61 Bcf for the week ending November 6. This was slightly below the 65 Bcf estimate, but higher than the five-year average of 40 Bcf. Traders will be watching whether next week’s cold temperatures in the East are enough to bring an end to the injection season.
The smaller-than-expected build offered some support, but it did not give buyers enough reason to push through this week’s high. With storage still building faster than normal, the market may need colder weather to last longer than currently forecast to generate a stronger rally.
December Natural Gas Futures Technical Analysis
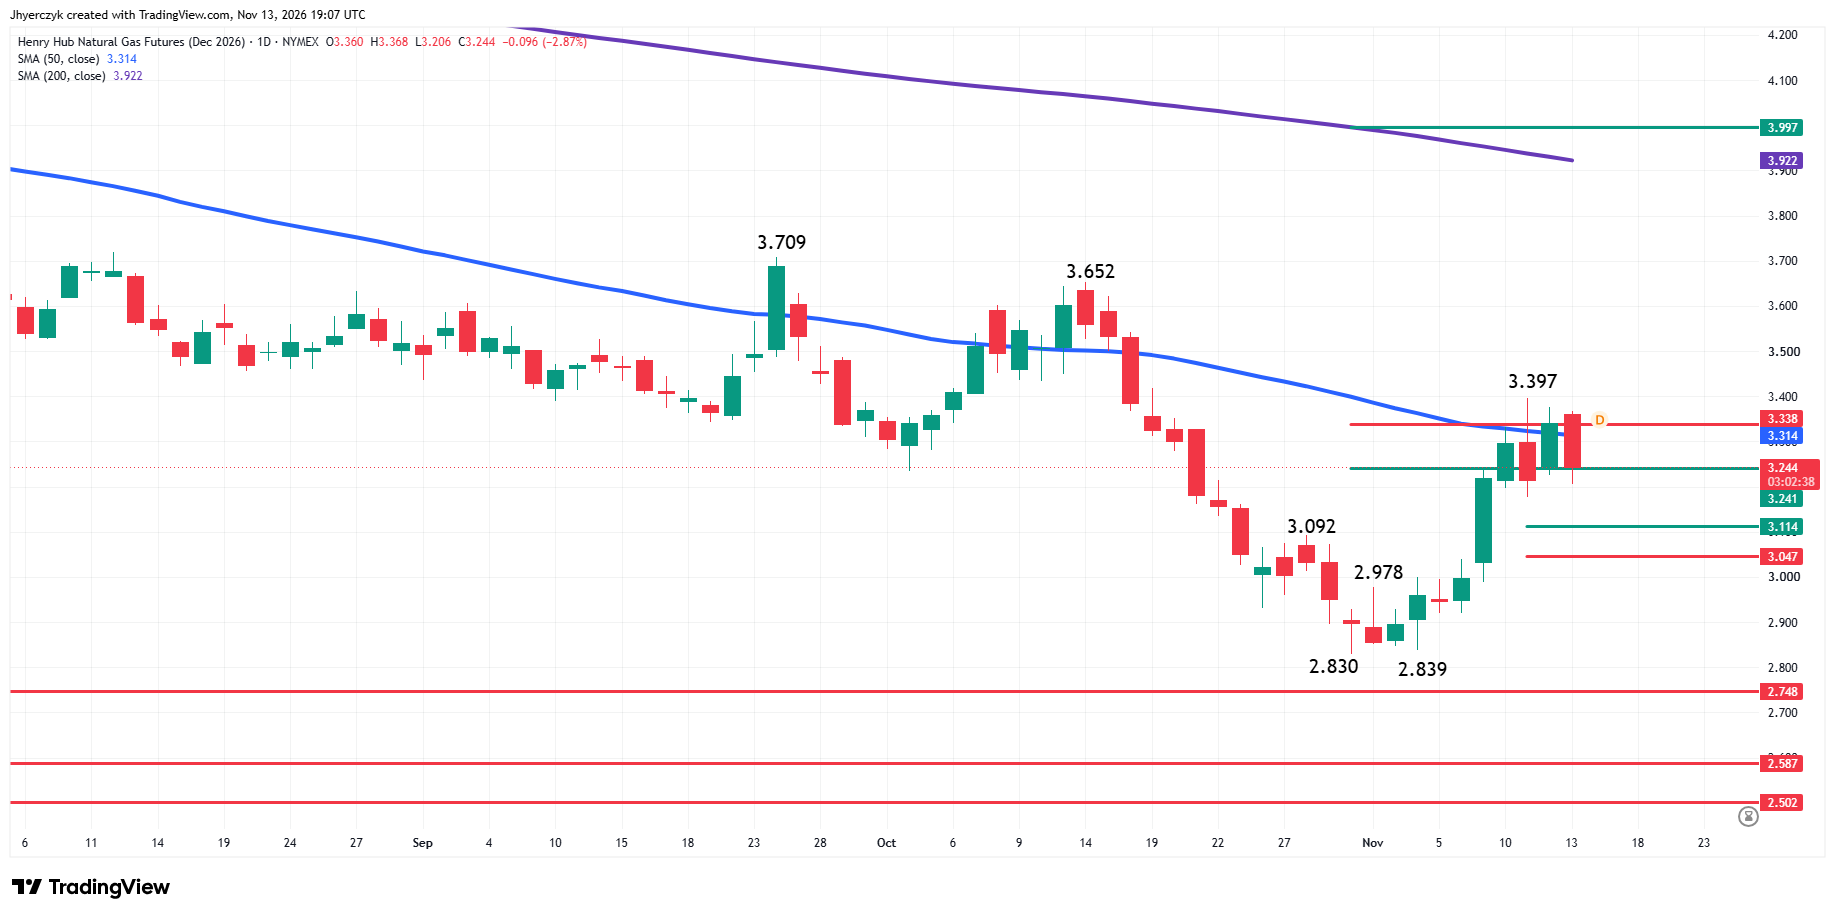
December Natural Gas futures are edging lower on Friday. The main trend is up according to the daily swing chart, however, Wednesday’s closing price reversal top has stopped the rally. A trade through $3.397 will negate the reversal top and signal a resumption of the uptrend. Taking out $3.177 will confirm the closing price reversal top. A move through $2.830 will change the main trend to down.
The confirmation of the closing price reversal top will not change the trend to down. It often forms to alleviate some of the upside pressure.
The intermediate range is $3.652 to $2.830. The market has been testing its retracement zone at $3.241 to $3.338 for four straight sessions. Trader reaction to this area is likely to determine the market’s near-term direction.
The short-term range is $2.830 to $3.397. Its retracement zone at $3.114 to $3.047 is the next downside target.
The market has also been straddling the 50-day moving average at $3.314 for four sessions. On Thursday, December natural gas closed on the strong side of this indicator, but buyers couldn’t sustain the move. Sellers then came in to drive the price to the weak side.
Natural Gas Price Forecast
Every new Natural Gas analysis as it publishes, today's technical signal and key levels, live price — on one page.
See all Natural Gas forecastsWhat to Watch
My bias remains to the upside because the main trend is up and traders have not confirmed the closing price reversal top. However, it is beginning to weaken because of the inability to sustain the move over the 50-day moving average at $3.314 and break out over $3.397.
The price action also suggests that the intermediate 61.8% level at $3.338 may be the actual trigger point for a resumption of the rally and a sustained breakdown under the 50% level at $3.241 could be the turning point for a steep break.
A trade through $3.177 will confirm the potentially bearish chart pattern. This will shift my bias to the downside at least temporarily. My near-term objective on this move will be the retracement zone at $3.114 to $3.047.
If enough buyers come in on a test of $3.114 to $3.047, then a secondary higher bottom could form. If confirmed, this could trigger the start of another rally. With enough momentum, buyers could make another attempt to overtake the 50-day moving average at $3.314, the intermediate 61.8% level at $3.338 and the main top at $3.397. Overcoming all of these levels would send a bullish signal.
If $3.047 fails to stop the selling pressure, then the decline could extend toward the main bottom at $2.830.
More Information in our Economic Calendar.