



June Natural Gas futures spiked to the upside last week in reaction to a bigger-than-expected storage draw. However, sellers came in to stop the rally and drive the market lower in anticipation of the first build in storage since December this week.
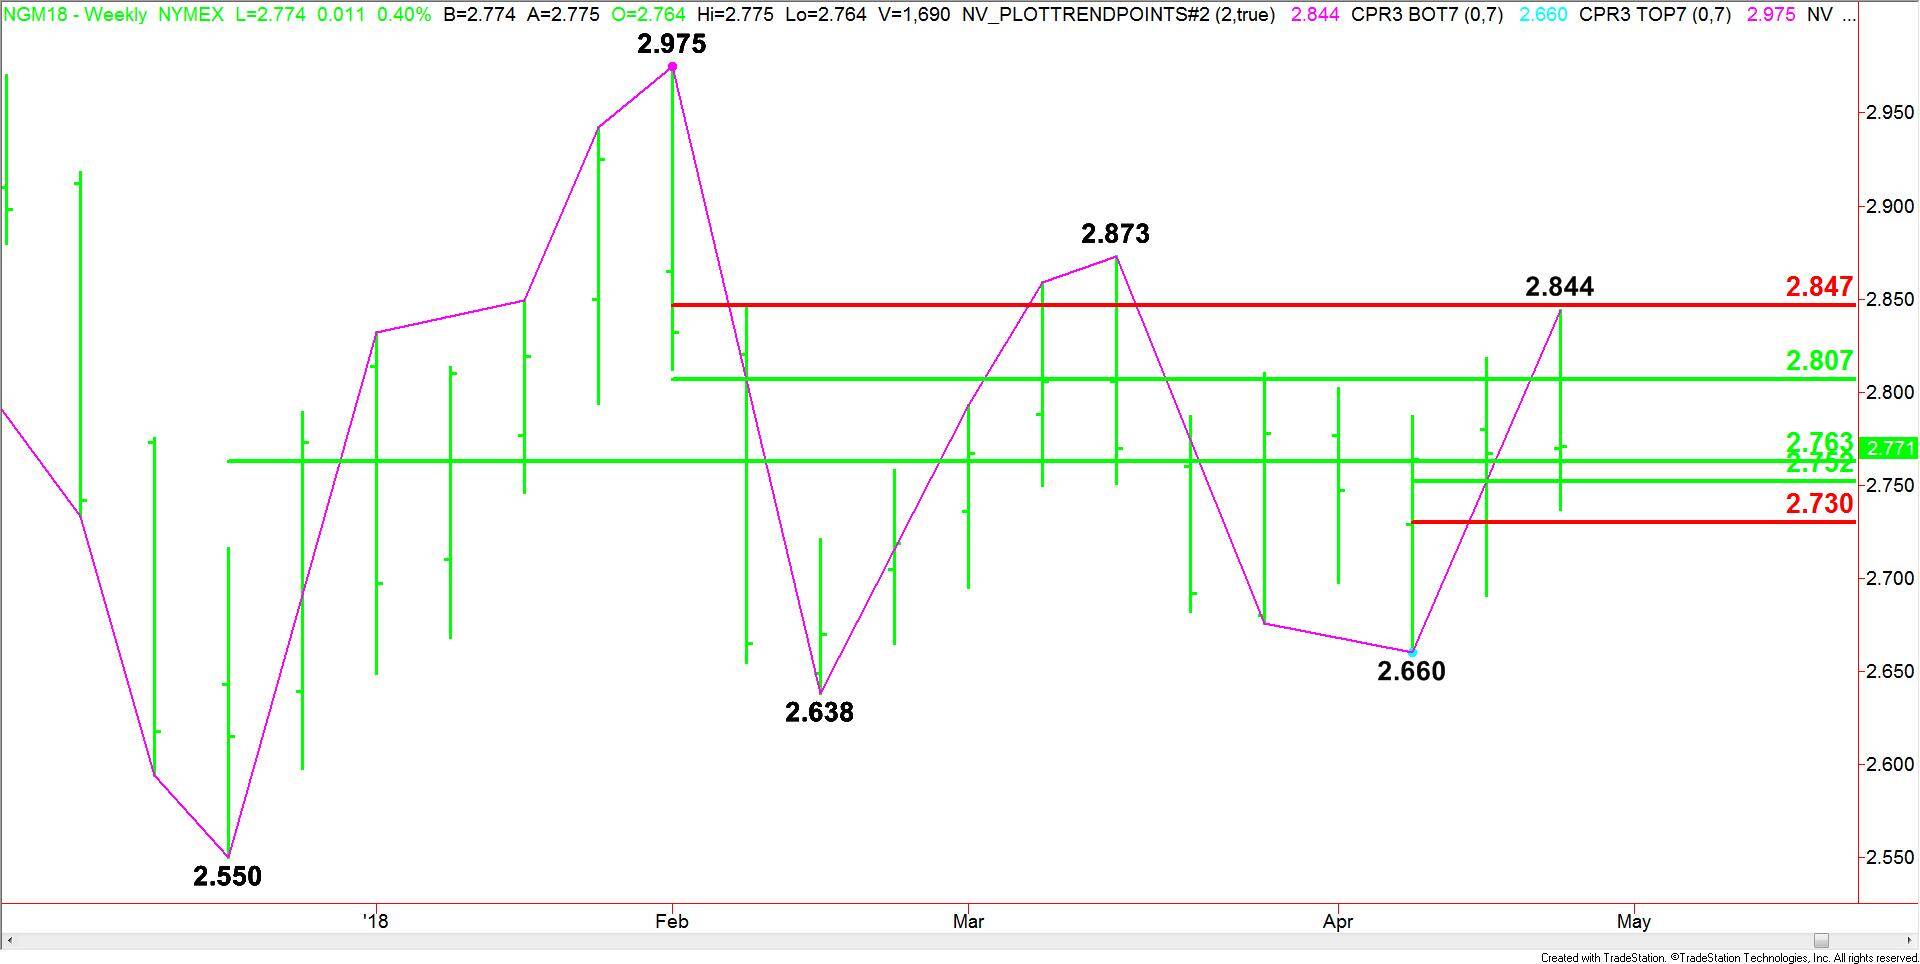
Weekly Swing Chart Technical Analysis
The main trend is up according to the weekly swing chart. However, momentum has been sideways for several weeks as traders await the delayed start of the injection season.
A trade through $3.873 will signal a resumption of the uptrend. A move through $2.660 will change the main trend to down.
During the sideways period, the price action has been controlled by a number of retracement levels.
The main range is $2.550 to $2.975. Its 50% level or pivot is 2763. This price level is controlling the longer-term direction of the market.
The intermediate range is $2.975 to $2.638. Its retracement zone at $2.807 to $2.847 is acting like resistance.
The short-term range is $2.660 to $2.844. Its retracement zone at $2.752 to $2.730 is acting like support.
Weekly Swing Chart Technical Forecast
Based on last week’s close at $2.771, the direction of the June Natural Gas market this week is likely to be determined by trader reaction to the main pivot at $2.763.
Holding above $2.763 and sustaining the move could fuel a rally into the intermediate 50% level at $2.807. Overcoming this level could trigger a further rally into last week’s high at $2.844, followed by the intermediate Fibonacci level at $2.847 and the main top at $2.873.
The main top at $2.873 is also the trigger point for an acceleration to the upside with $2.975 the next major upside target.
A sustained move under $2.763 will signal the presence of sellers. This is followed closely by the short-term retracement zone at $2.752 to $2.730.
Natural gas could start to accelerate to the downside if $2.730 is taken out with conviction. This could trigger a further break into the main bottom at $2.660.
Taking out $2.660 will change the main trend to down. Another trigger point for an acceleration to the downside is $2.638.