


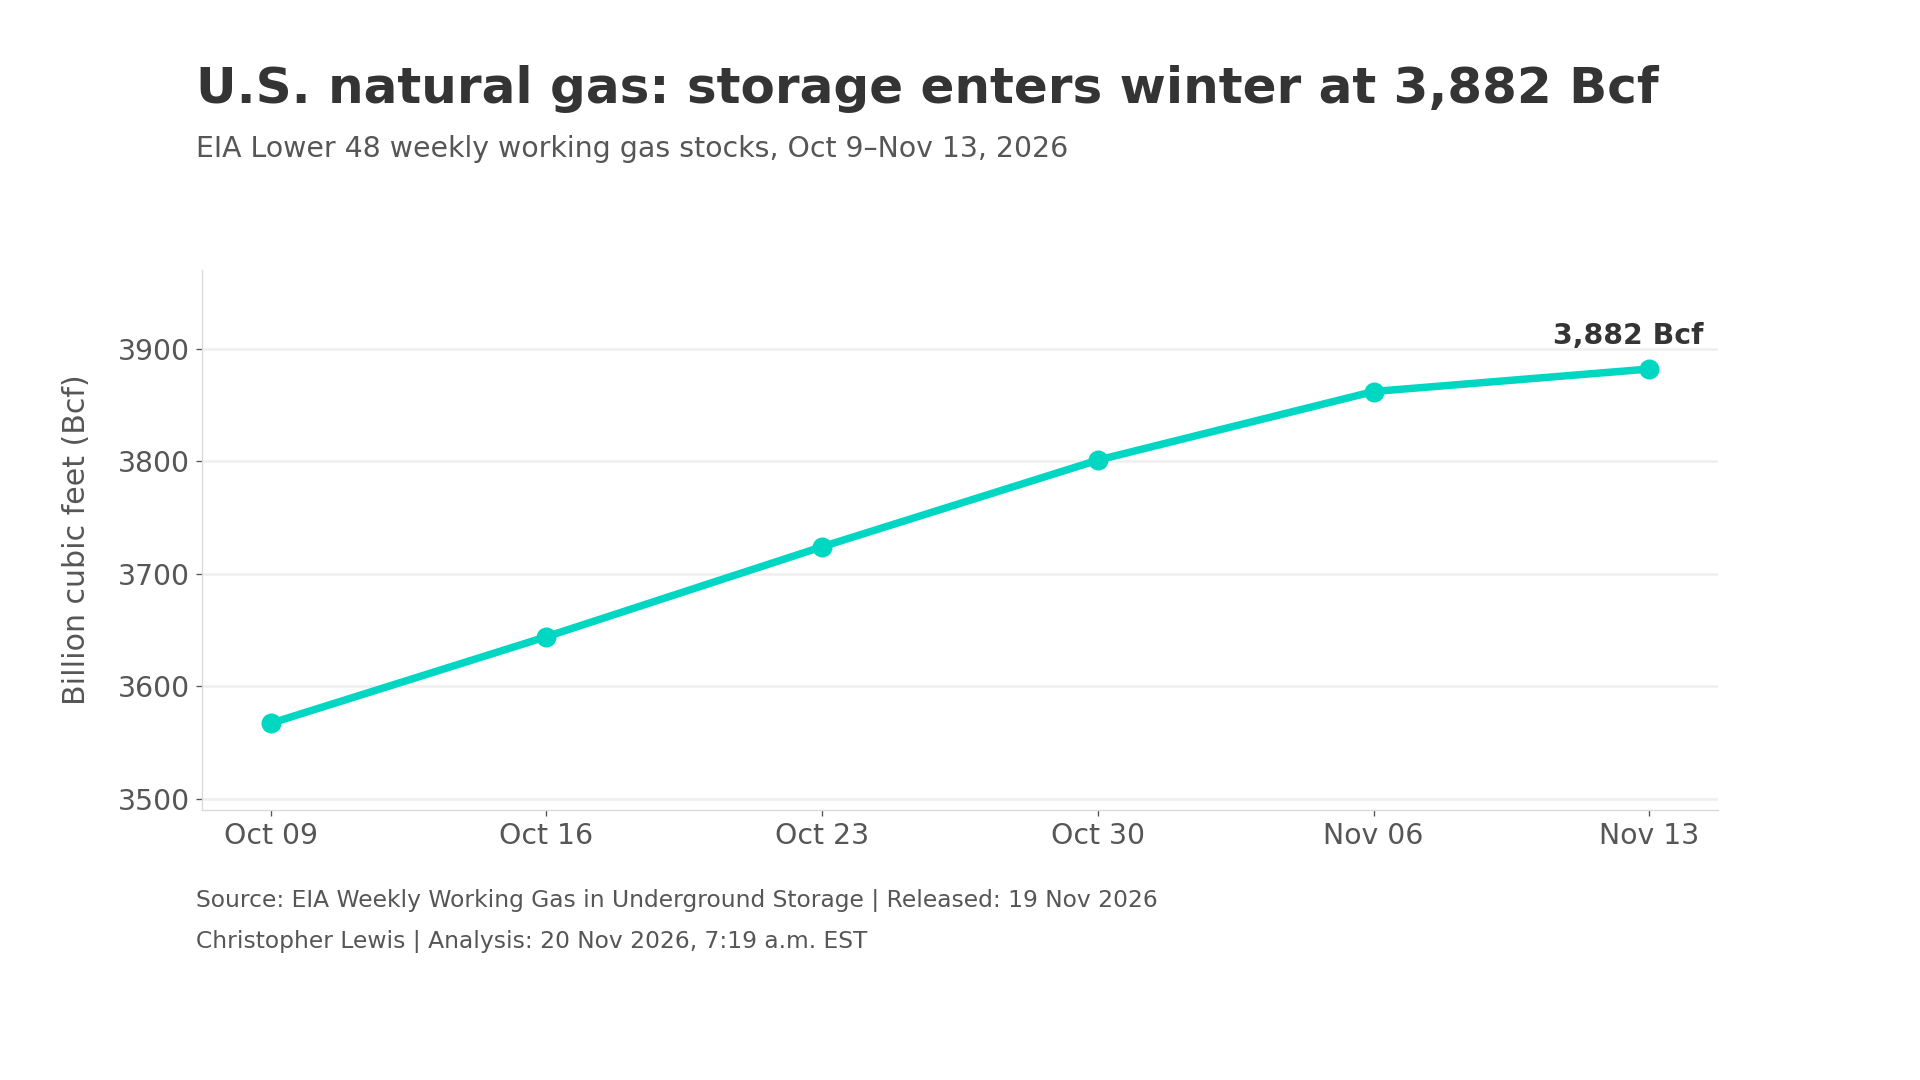
The natural gas market received its latest inventory update yesterday, and the EIA’s Weekly Natural Gas Storage Report puts Lower 48 working gas in storage at 3,882 billion cubic feet for the week ending November 13. That was an increase of 20 billion cubic feet from the previous week.
National storage is not particularly scarce. The same EIA release shows working gas 66 billion cubic feet below the year-earlier level, but 80 billion cubic feet above the 5-year average for this point in the calendar. The year-on-year deficit and the seasonal surplus are both true. They describe different comparison groups. A trader can be misled by looking at just one.
Cushion of Gas Not as Strong as Last Year, but Higher than 5-Year Average
The better interpretation is that inventories have a cushion against the usual seasonal level, although that cushion is not as much as last year. The pace of change is noticeable. EIA’s weekly historical table shows storage rising from 3,567 billion cubic feet in the week of October 9 to 3,882 billion cubic feet by November 13. The most recent 20 billion cubic feet addition was much smaller than the previous week’s 61 billion cubic feet. This illustrates that we are, in fact, transitioning toward winter. The storage system can continue to add gas while weekly injections shrink.
Regional details are more instructive than the national gas figure alone. The East region, one of the most important, was unchanged at 938 billion cubic feet. The Midwest edged down from 1,129 billion cubic feet to 1,128 billion cubic feet. The South Central region, by contrast, added 13 billion cubic feet to reach 1,248 billion cubic feet. Mountain and Pacific stocks increased by 3 billion cubic feet and 5 billion cubic feet, respectively.
These changes matter because gas is not interchangeable among all storage regions. Pipeline capacity, local weather, and demand around the Gulf Coast can make the same nationwide stock level feel quite different to customers in different places. In particular, we can take the South Central region as an example. Its 1,248 billion cubic feet is slightly below its 5-year average of about 1,251 billion cubic feet.
Even though total U.S. working gas was above its seasonal average, South Central salt cavern inventories stood at 323 billion cubic feet, compared to a roughly 337 billion cubic feet 5-year norm. Salt facilities provide operational flexibility for rapid injection and withdrawal, so the gap does deserve a certain amount of attention. It is not necessarily a sign of a national shortage, but it is relevant when winter weather or LNG export demand draws on supplies near the Gulf region.
Natural Gas Price Forecast
Every new Natural Gas analysis as it publishes, today's technical signal and key levels, live price — on one page.
See all Natural Gas forecastsWeather, of Course, Is the Next Factor
The National Weather Service Climate Prediction Center’s November 19 six-to-ten-day outlook covers November 25 through November 29. It favors above-normal temperature readings in significant parts of the United States, especially in the north, with a cooler risk over portions of southern and southeastern states. In its written discussion, it cautions that storm-track uncertainty affects the regional picture.
CME Market Review
CME Group’s November 19 market review puts the 20 billion cubic feet injection against an estimated 28 billion cubic feet market expectation and a roughly 15 billion cubic feet 5-year average injection for the comparable week. These comparison figures come from CME’s market commentary, not from the EIA estimate of storage.
Demand questions will be rather straightforward at this point in time. A warmer northern tier reduces the need for space heating in heavily populated regions such as New York, Boston, and Philadelphia, while colder-than-normal weather near the Gulf can support localized consumption. Whether either signal translates into Henry Hub price pressure depends on production, pipeline flexibility, electric-sector use, and deliveries to export terminals, something that could become a much bigger story later this year.
Natural Gas STEO
For context, the EIA’s November 10 Short-Term Energy Outlook forecasts a $2.87 per million British thermal units Henry Hub spot-price average from November to March, 16% below its October projection for that period. That number is an EIA forecast for a multi-month average and therefore can fluctuate. The agency also projects that U.S. LNG gross exports increase from roughly 15 billion cubic feet per day to around 19 billion cubic feet per day next year.
Technical Analysis
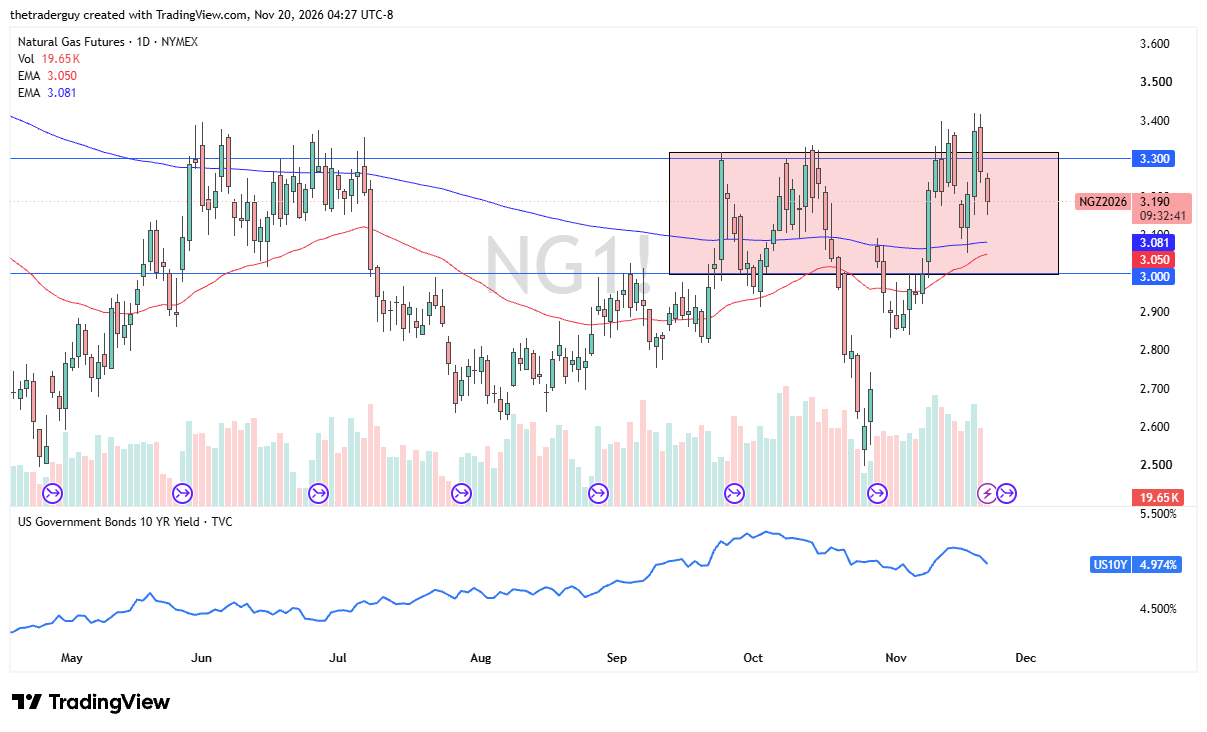
Looking at the charts, we can see that we had fallen pretty significantly during the early part of the session, but buyers are coming in to pick up the dip. That does make a certain amount of sense considering the time of year, and therefore I follow the same kind of pattern. I look for dips to buy, but I am not looking for big moves yet. The weather just simply is not cooperating with a bullish market.
A move above the $3.40 level could open up an even bigger move to perhaps higher targets such as $3.60, possibly even $3.80 if the buyers are jumping in. The 50-day EMA is starting to rise, perhaps getting ready to cross above the 200-day EMA for the so-called golden cross.
If you’d like to know more about how to trade natural gas, please visit our educational area.