


Natural gas prices edged lower on Wednesday ahead of Thursday’s inventory report from the Department of Energy. While the weather has been warmer than normal over most of the East Coast of the U.S., the forecast is for colder than normal weather to cover most of the country over the next 2-week period. Weaker than expected Chinese PMI data weighed on riskier assets spilling over into natural gas prices.
Technical
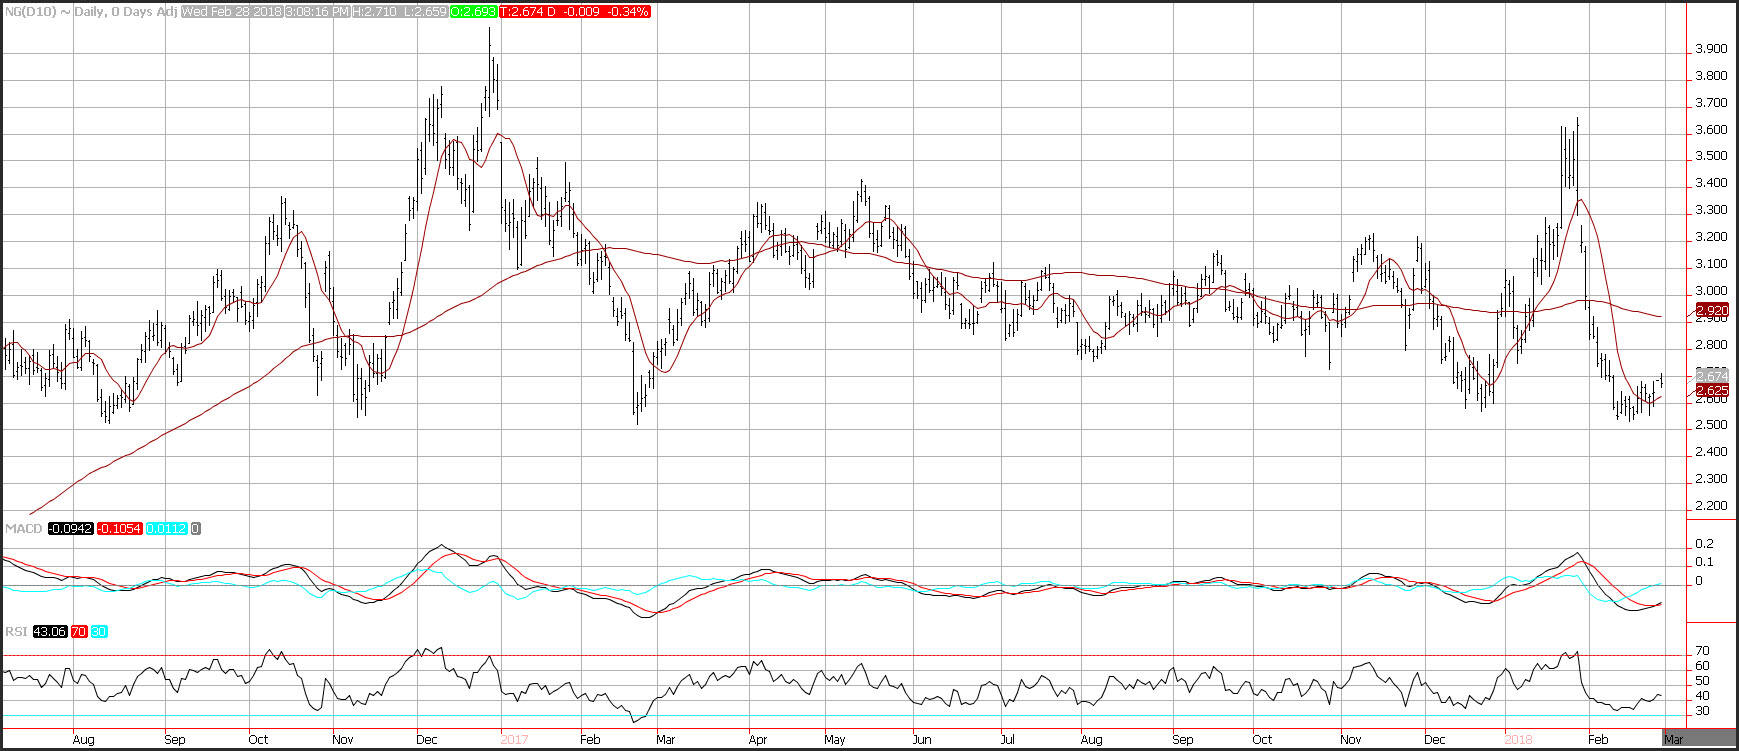
Natural gas moved lower and continued to consolidate just above support following a 28% drubbing that natural gas prices received from late January and throughout February. Support is seen near the 10-day moving average at 2.625, while resistance is seen near the 100-day moving average at 2.92. Momentum has turned positive as the MACD (moving average convergence divergence) index generated a crossover buy signal. This occurs as the MACD line (the 12-day moving average minus the 26-day moving average) crosses above the MACD signal line (the 9-day moving average of the MACD line). The MACD histogram is printing in the black with an upward sloping trajectory which points to higher prices for natural gas.
Chinese PMI Disappointed
The official Chinese Purchasing Managers’ Index fell to 50.3 in February, from 51.3 in January. That would mark the 20th straight month of expansion for China’s manufacturers, but the sharper drop may raise some concerns for China’s leaders as they prepare for the start of the National People’s Congress next week where Beijing will unveil its economic targets for this year. The index for output stood at 50.7, down from 53.5 in January. Total new orders also expanded much slower in February.
Canada’s IPPI rose 0.3% in January, month over month, after the 0.1% dip in December. The IPPI slowed to a 2.0% year over year pace in January from a 2.3% year over year gain in December. The RMPI climbed 3.3% in January month over month, following the 0.9% decline in December. The report is close to expectations, as the energy price bounce revealed in the January CPI was projected to drive the IPPI higher in January. The IPPI’s petro and energy index gained 3.4% in January month over month, driving the gain in the total IPPI during the month.