


$3.04 Rejection Puts Recovery in Doubt
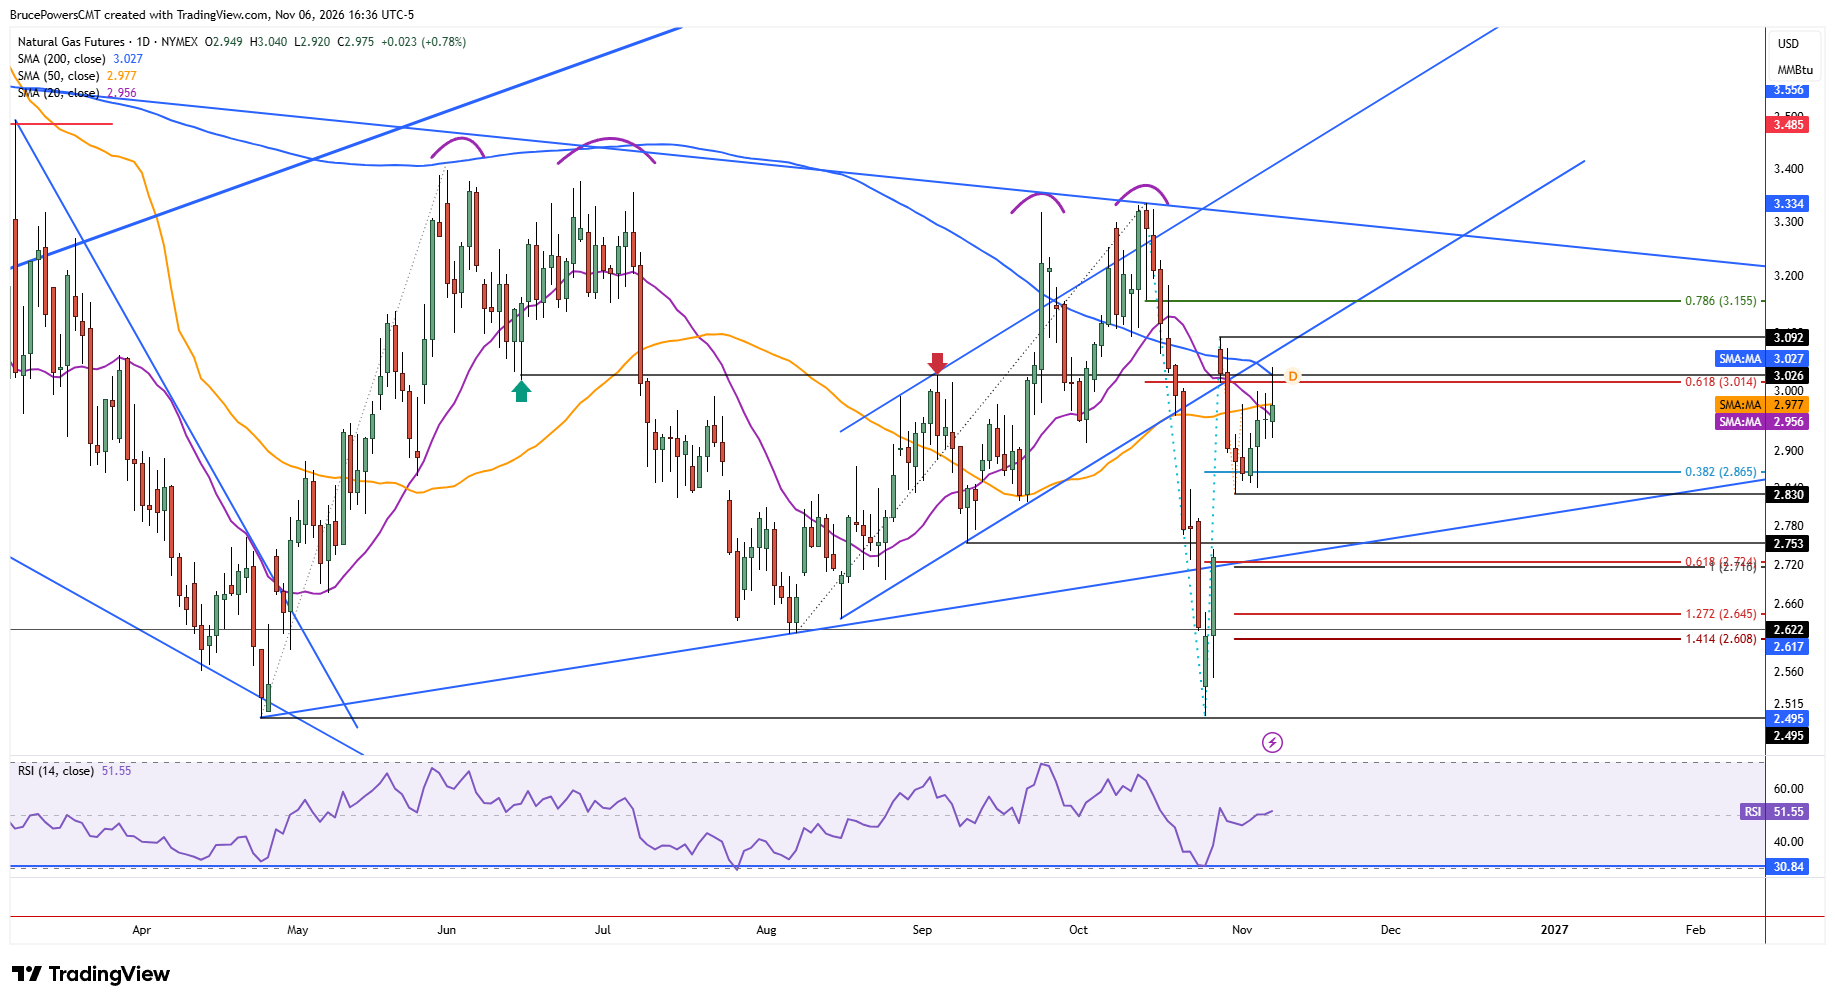
Natural gas continued to strength on Friday, advancing to a six-day high of $3.04 before resistance was encountered near the 200-day moving average. Sellers regained control from there and pushed prices lower. Given the potential for continued strong resistance near the 200-day moving average and the broader price structure, Friday’s high may be an important pivot level that could lead additional downside pressure, which could establish a lower swing high. Resistance near the 200-day moving average is reinforced by the lower boundary of a rising channel and the 61.8% Fibonacci retracement of the prior advance at $3.01.
Support Levels Define Downside Risk, Breakout Scenario
Key short-term support is at Thursday’s low of $2.92 and a drop below it would establish a lower swing high and increase the chance that sellers may get more aggressive from there. Last week’s higher swing low of $2.83 marks a support level from structure, followed by a higher swing low at $2.75. The 61.8% Fibonacci retracement provides a lower potential support target at $2.72.
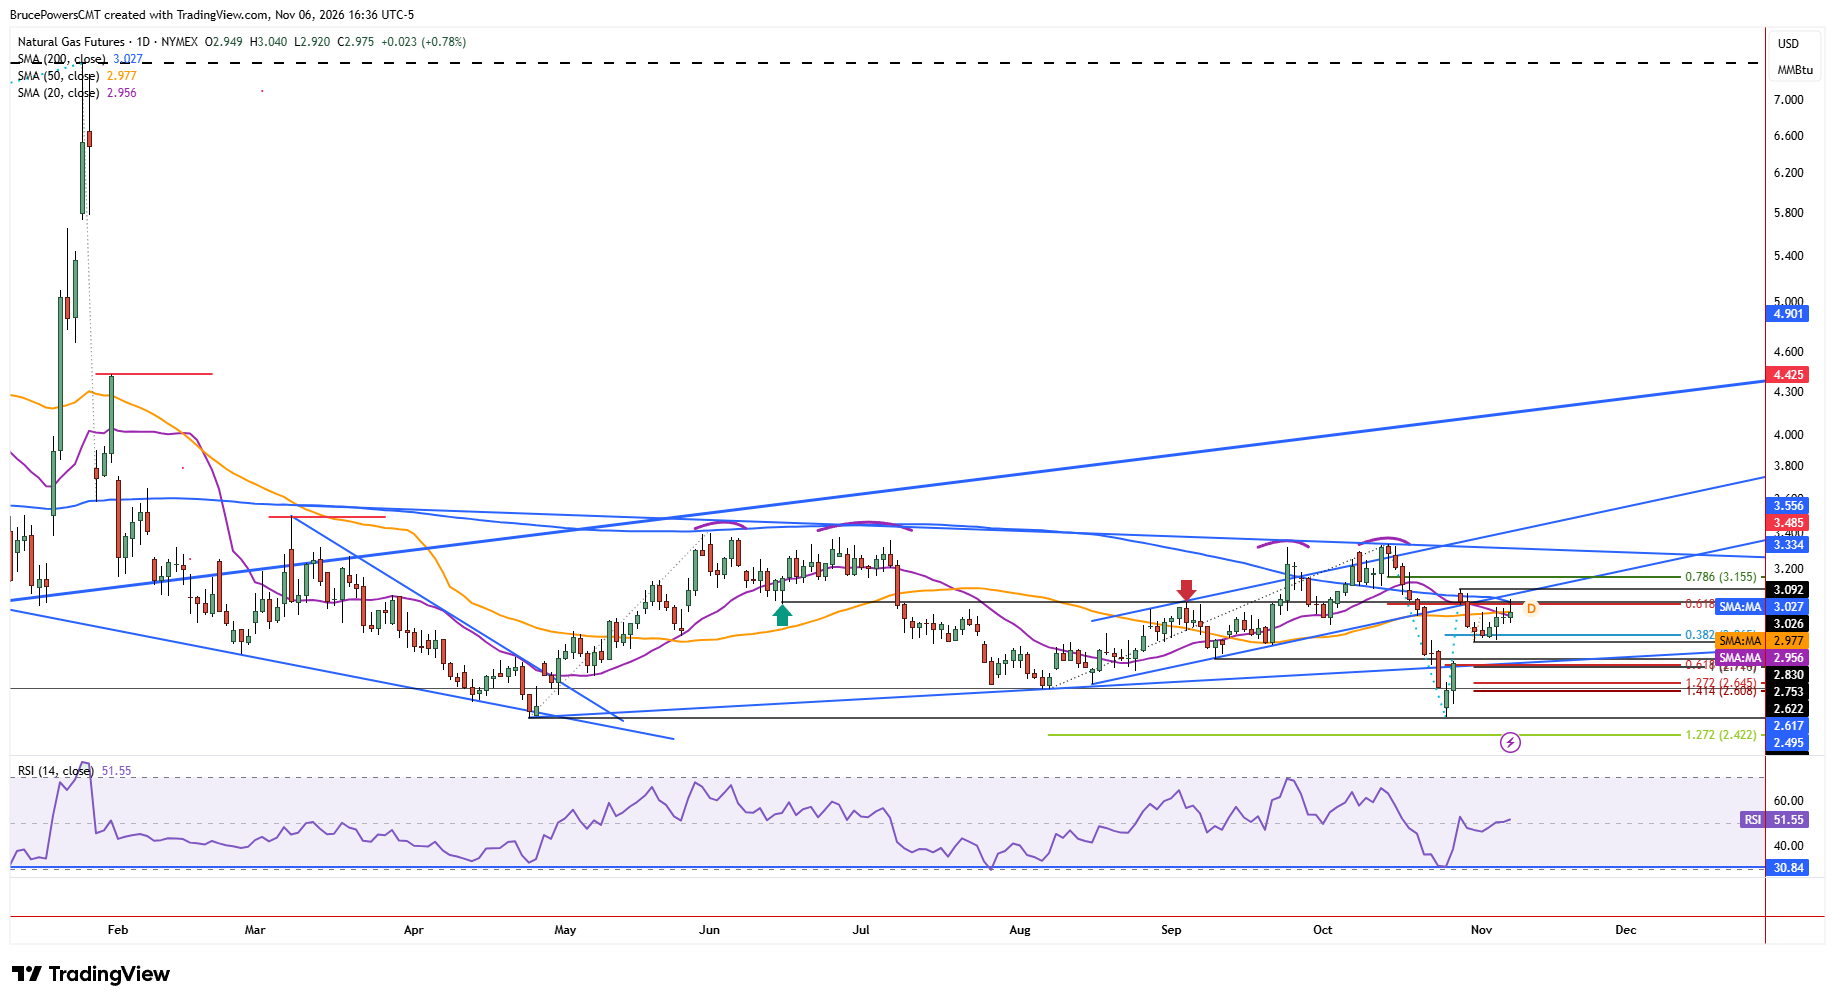
Alternatively, an upside breakout above Friday’s high of $3.04 could be the beginning of a change in character for natural gas due to another reclaim of the 200-day moving average. However, it would need to be followed by further signs of strengthening. That would occur on a subsequent rally above last week’s high of $3.09, with the 78.6% Fibonacci retracement of the prior decline at $3.155 providing the next upside target.
200-Day Average Remains Critical Trend Barrier
The 200-day moving average is a key dynamic resistance indicator for natural gas, since it was recognized as an area of resistance since a break below that average in February. During the previous two upswings, double top patterns were established showing buyers making a real effort to push prices higher. Notably, the 200-day moving average represents an area of potential dynamic resistance. The most recent advance was able to rise above and stay above that average for nine-days, before it failed with a decline below it. Therefore, another sustained reclaim of that average has the potential to eventually challenge resistance at the recent lower swing high of $3.33.
If you’d like to know more about how to trade natural gas, please visit our educational area.