


Sellers Press Toward August Support
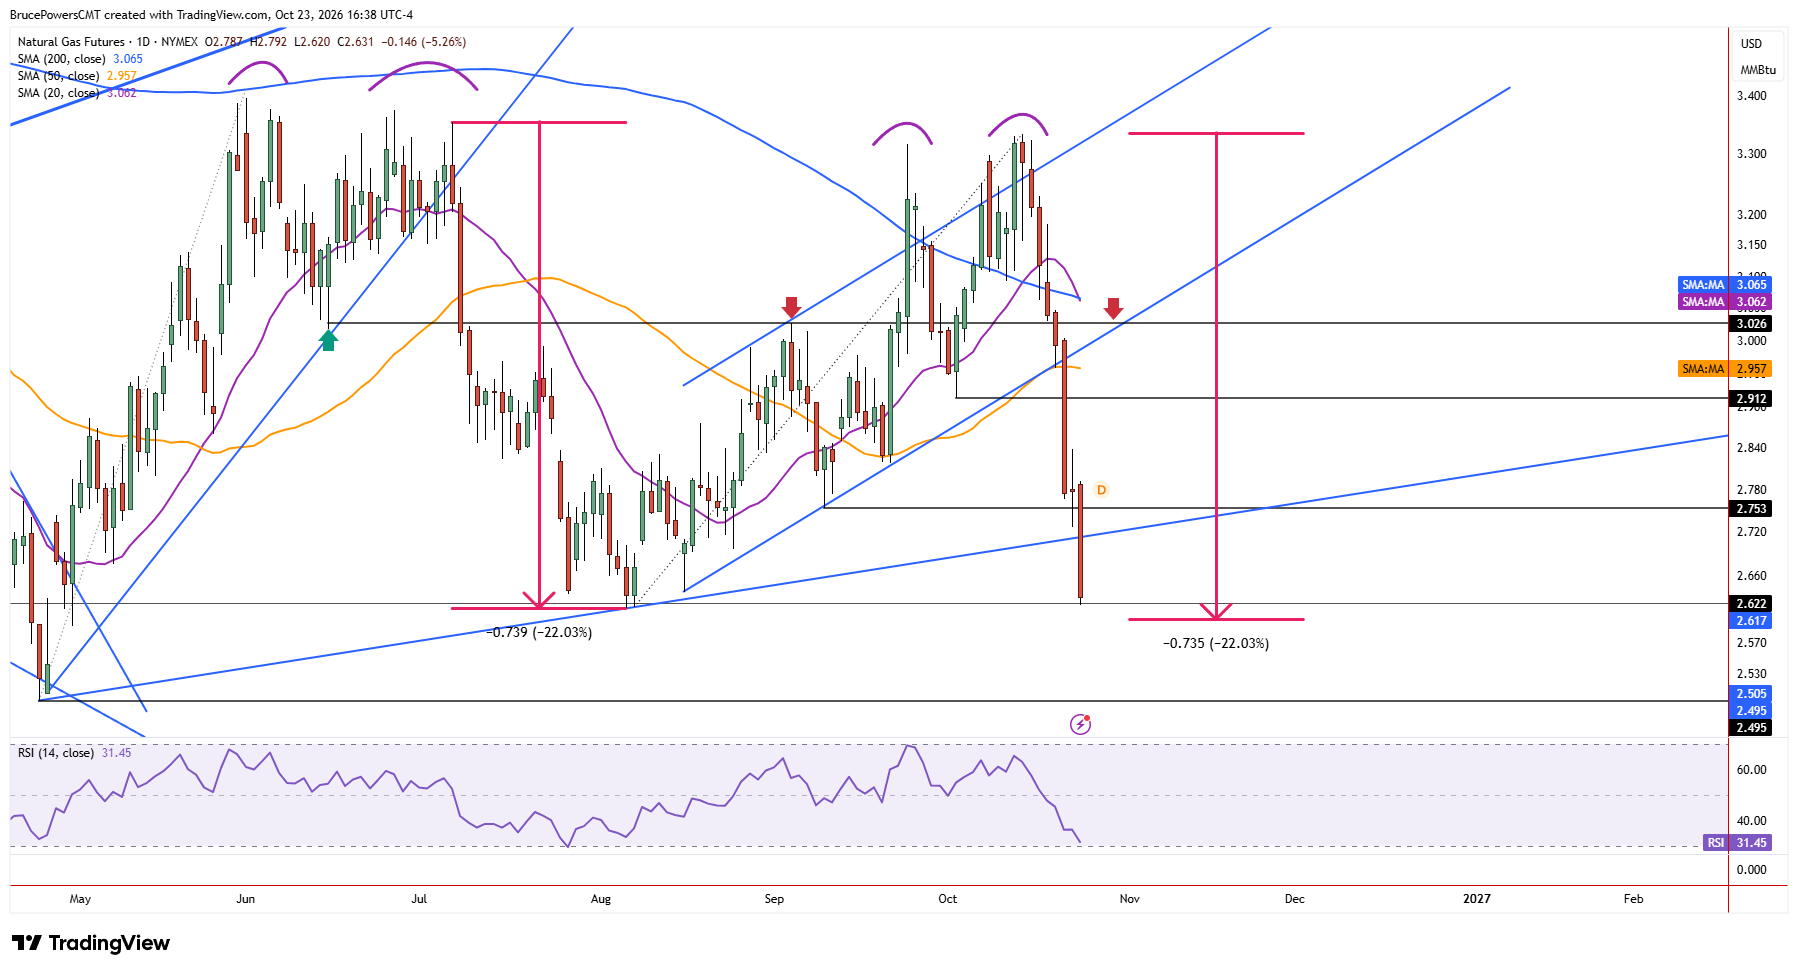
Natural gas extended its sharp decline on Friday, reaching a new corrective low of $2.62 at the time of writing, as it tested support at the higher swing low of $2.62 from August. Sellers remain in control and could reach a lower level before the close. Given the current trajectory and decisive bearish momentum from this week, that level looks likely to break. It also looks possible the sellers could become exhausted shortly after breaking the August low. Although a bearish continuation signal would trigger below that low, there is a measured move target near $2.60 that could stall the decline or lead to a bounce, generating a range from approximately $2.62 to $2.60.
Failed Recovery Reinforces Bearish Structure
The recent highs led to a lower swing high and two failed attempts to reclaim the 200-day moving average, representing long-term dynamic resistance. That is bearish behavior that has now been confirmed by this week’s sharp decline and weak close, opening the door to a possible test of the April low at $2.50.
Countertrend Rallies Face Layered Resistance
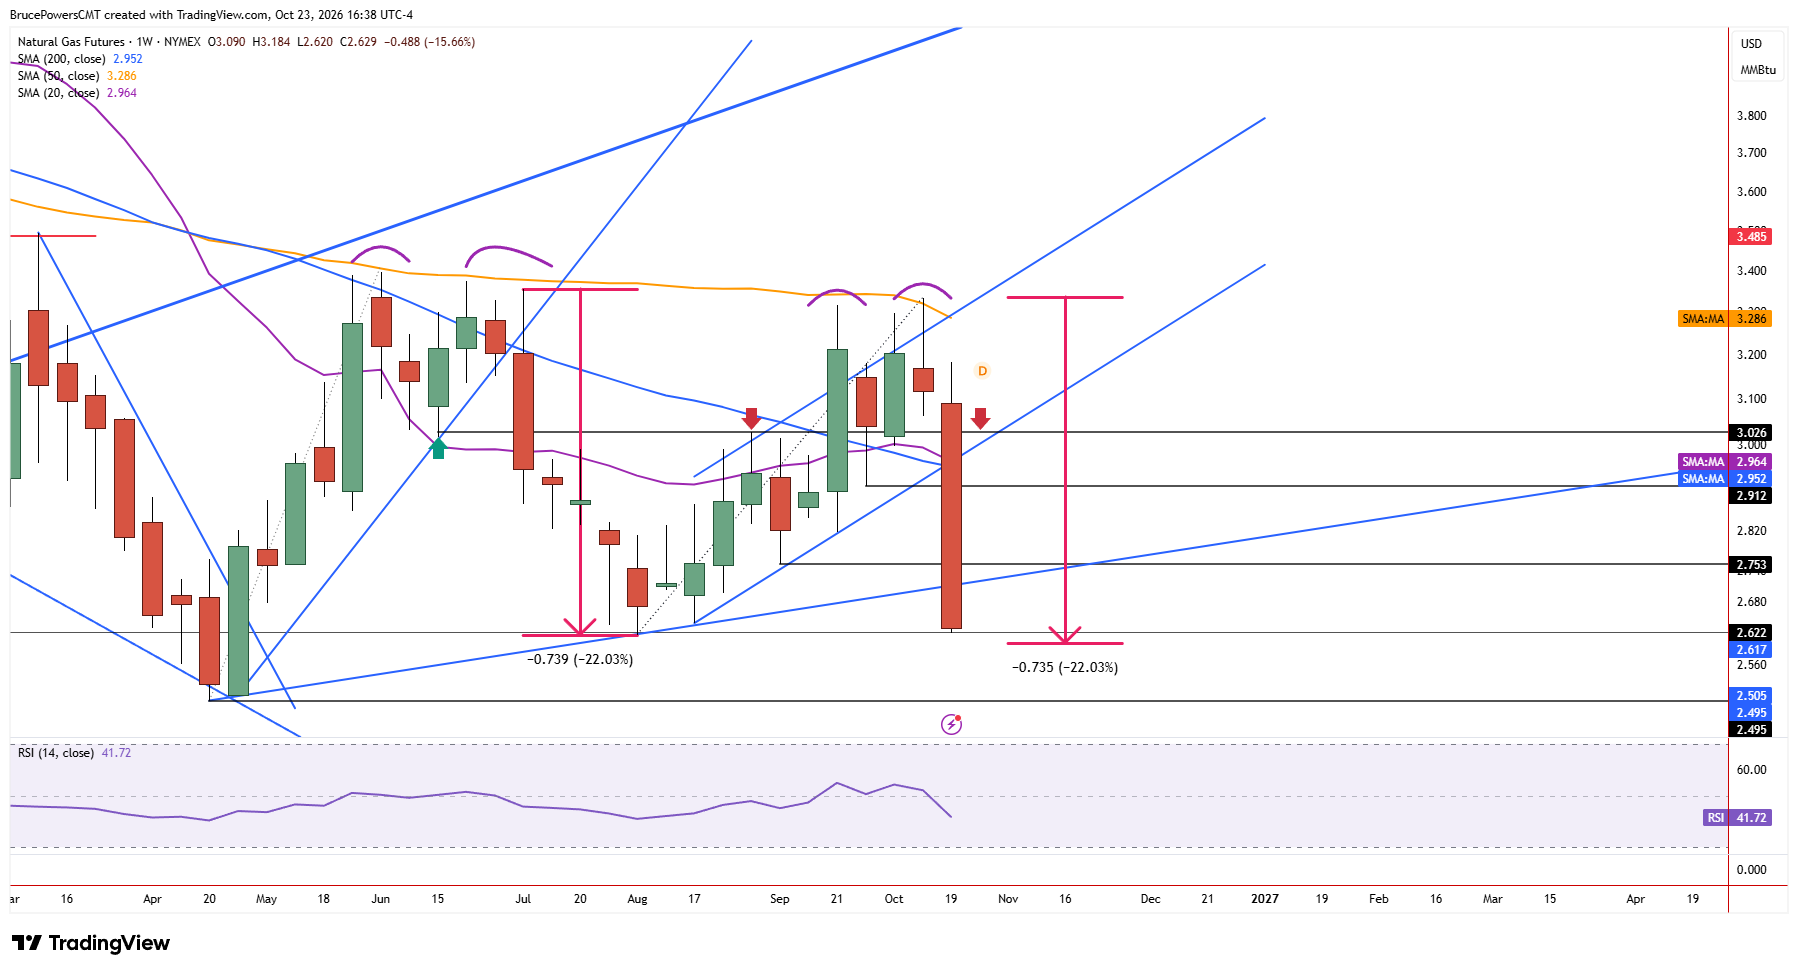
If support is found near this week’s low, there are several key potential resistance levels that may be tested on a countertrend rally before sellers take back control in alignment with the dominant bearish trend. An initial resistance zone is near the higher swing low of $2.75, followed by a higher swing low at $2.91. The more significant area is near this week’s breakdown level for a rising channel and 50-day moving average. Tuesday’s low of $2.96 can be used as a proxy for that zone. The 50-day moving average is now at $2.96 as well.
Rally Strength Will Reveal Shifting Pressure
The speed and magnitude of the countertrend rally, whenever it occurs, should provide clues about changes in supply and demand and either support or negate this week’s technically bearish implications. An example can be seen in the prior downswing. It hit support and consolidated tightly before continuing lower, rather than bouncing higher before sellers took back control.
If you’d like to know more about how to trade natural gas, please visit our educational area.