


April Low Faces Renewed Selling Pressure
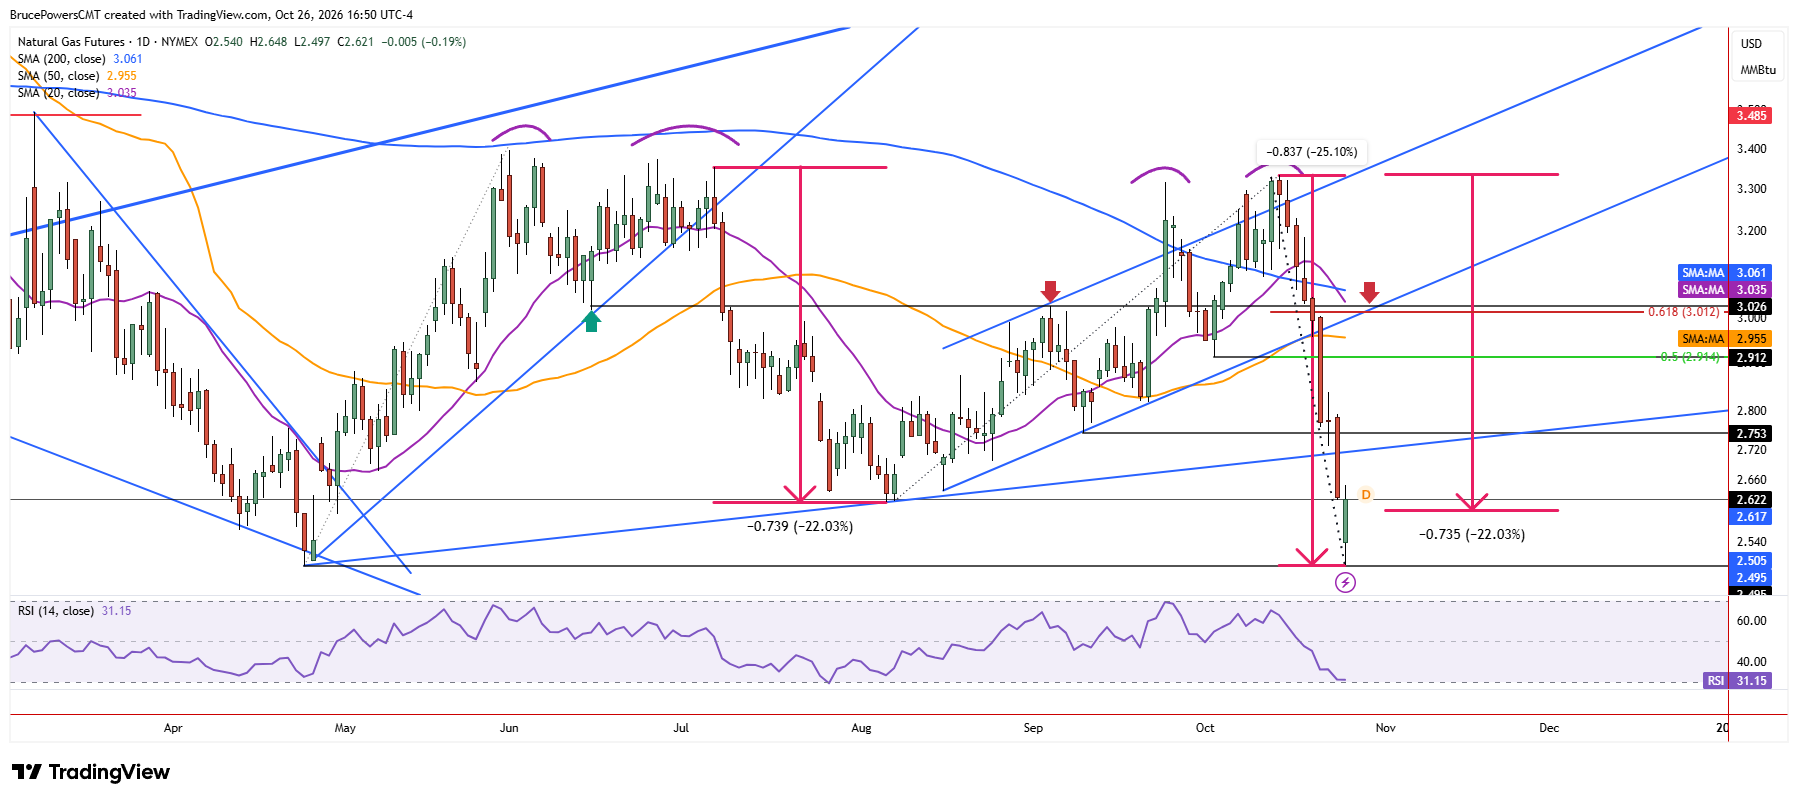
Natural gas extended losses on Monday to a new low of $2.50 and a test of support near the prior low of $2.495 from April. A bearish signal triggered with a decline below the higher swing low at $2.62 from August earlier in the session, confirming that sellers were in control.
In addition to establishing a lower swing high recently, an unsuccessful attempt to reclaim the 200-day moving average during the advance further confirmed the structure of the bearish trend. Moreover, the current downswing of around 25% exceeded the prior decline, which was 22%. Taken together, natural gas is showing the potential to eventually break below the April low.
Oversold Conditions Could Spark a Relief Rally
Nonetheless, for the time being, it looks like a counter-trend rally or consolidation could occur next given the possibility that the decline is overextended. This is evidenced by the intraday advance that followed the session low. A lower daily high of $2.65 is near-term resistance.
If broken to the upside there is potential resistance indicated near the higher swing low of $2.75, followed by another higher swing low at $2.91. But since a breakdown of the 50-day moving average, currently near $2.96, triggered with a break below a lower rising channel boundary, a full pullback could eventually test it as resistance.
Rectangle Formation Could Take Shape
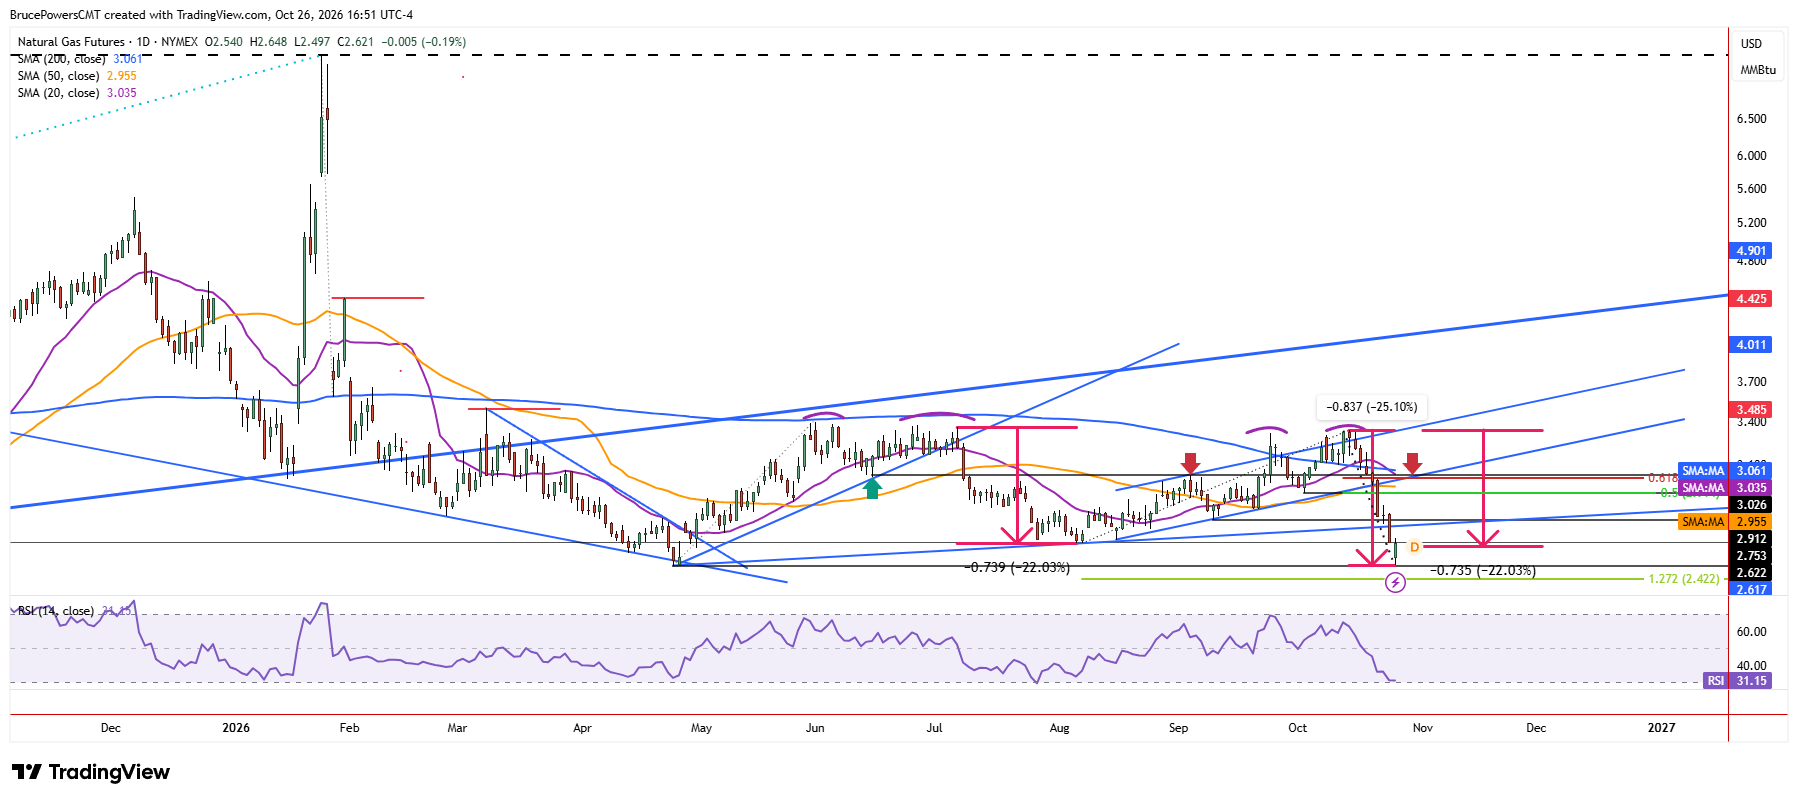
For now, it looks like natural gas could trade within last week’s range of $3.18 to $2.50 as recent declines are digested. If a swing low is established from Monday’s low, a large rectangle consolidation pattern will have formed, raising the possibility of further range-bound trading. Another day or two of trading should start to define a bottom if Monday’s low is retained as support. But given the possibility that strong support may have been reached, traders will be watching for new opportunities during short-term weakness.
If you’d like to know more about how to trade natural gas, please visit our educational area.