


Renewed Breakout Attempt Gains Momentum
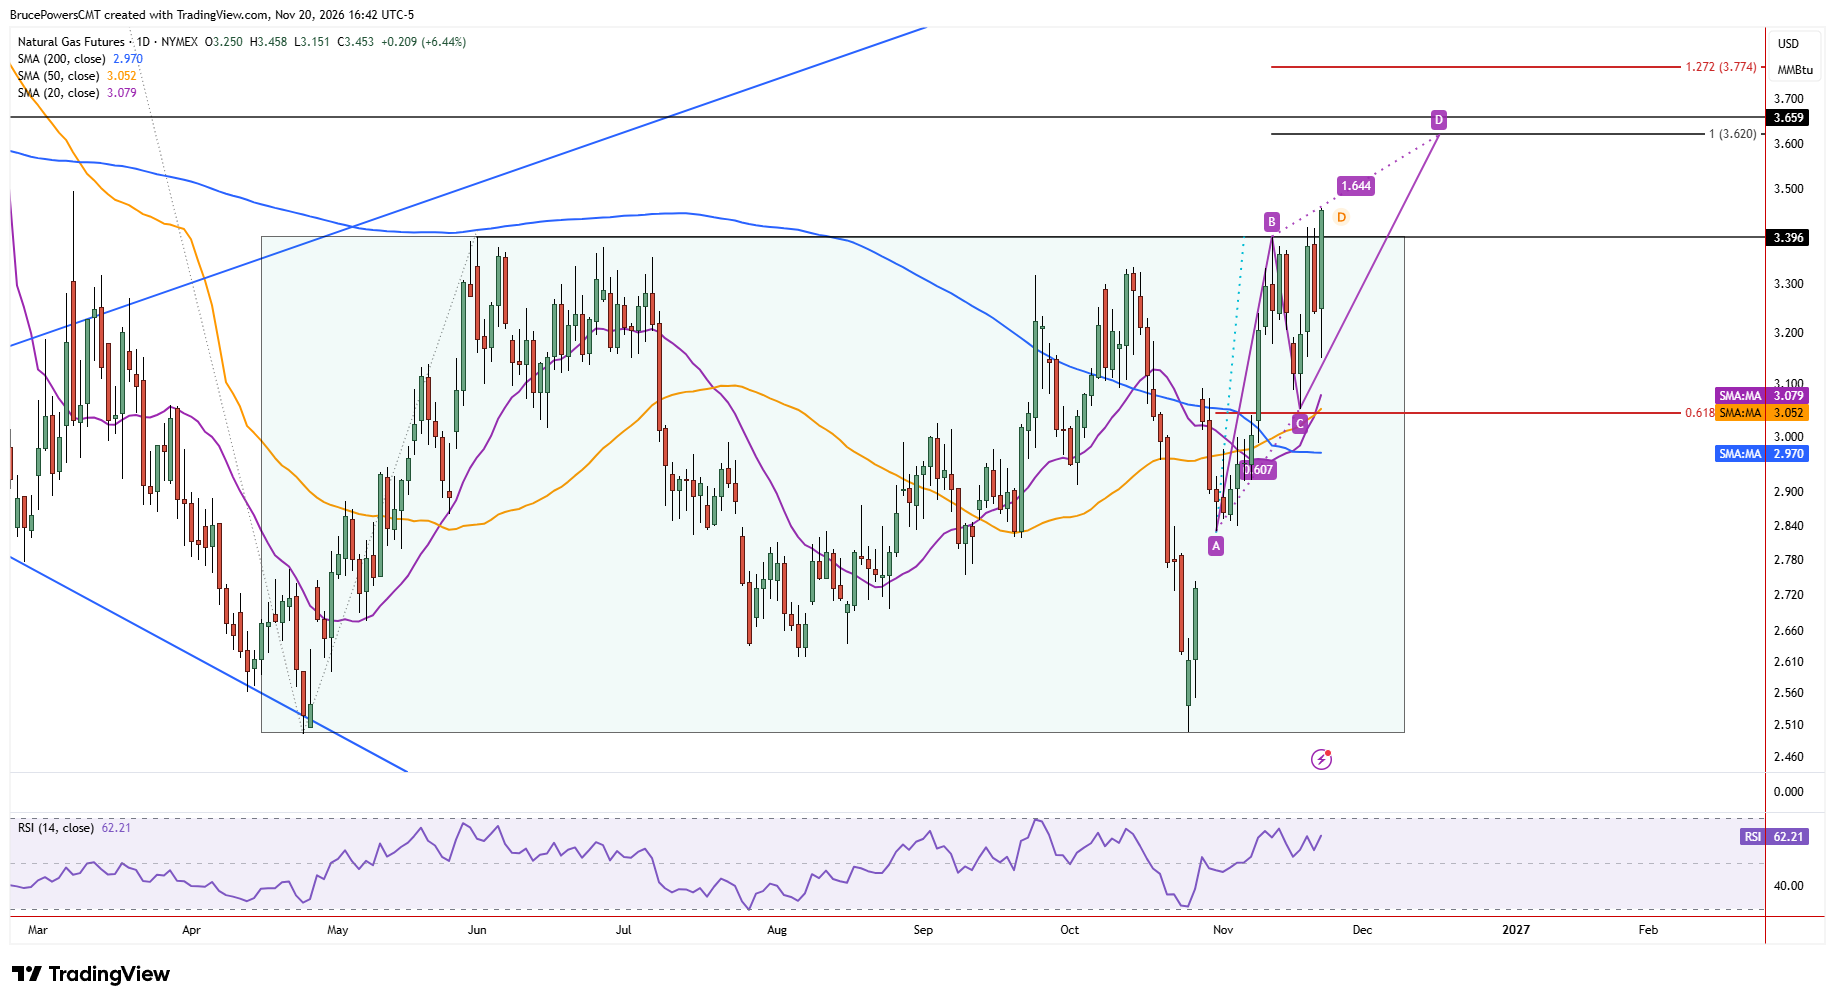
Natural gas extended recent gains to a new high of $3.46 on Friday, making another attempt at an upside breakout from a large rectangle consolidation with a high of $3.40. Although the prior two sessions triggered breakout attempts, it was not confirmed with a close above $3.40, and there was no upside follow-through. That may be starting to change, but additional signs of strength are still needed. Earlier in the session, natural gas reached a three-day low $3.15, before sellers regained control. The subsequent recovery produced a bullish outside-day pattern, adding to the evidence that buyers may be regaining control.
Closing Strength Could Confirm a Trend Shift
An important change to recent price action occurred, with Friday’s close is on track for highest daily and weekly closing price since early February. That is a bullish signal since it exceeds prior closes during the formation of the rectangle pattern. However, further bullish evidence is needed to confirm an upside breakout from the rectangle and a potential bullish trend reversal. A decisive advance above Friday’s high would signal an extension of the breakout and increase its chances off success in meeting potential upside resistance targets.
Key Support Defines Upside Breakout Risk
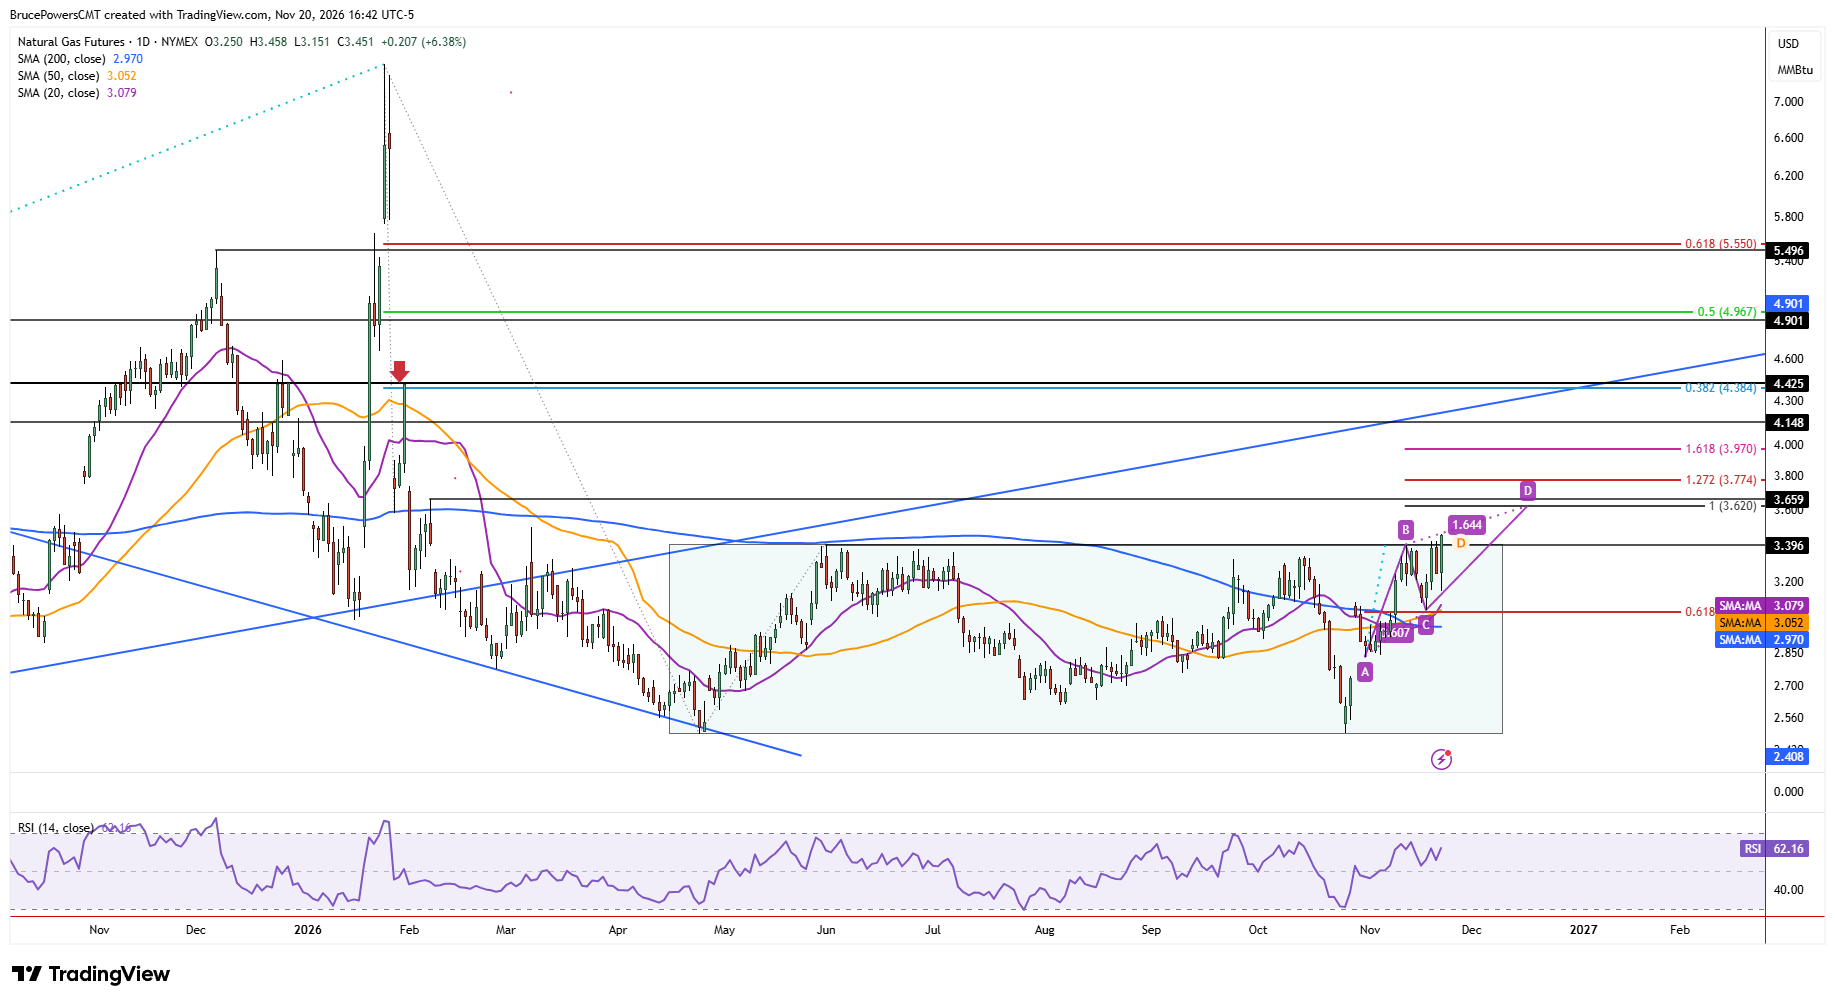
Friday’s low of $3.15 is now key near-term support, since a decline below it would negate the short-term bullish implications of the outside day and the bullish breakout attempt. A daily close above $3.42 would further confirm strength and increase the chance that natural gas may head towards upside targets.
A simple measured move, as represented by a rising ABCD pattern projects to an initial 100% target at $3.62, which is near a lower swing high of $3.66 from February. That price zone is followed by 127.2% and 161.8% Fibonacci projections at $3.77 and $3.97, respectively. However, the 38.2% Fibonacci retracement of the prior decline near $4.38 also represents a potential upside target if a rectangle breakout is confirmed.
If you’d like to know more about how to trade natural gas, please visit our educational area.