


Bullish Momentum Builds Above Key Average
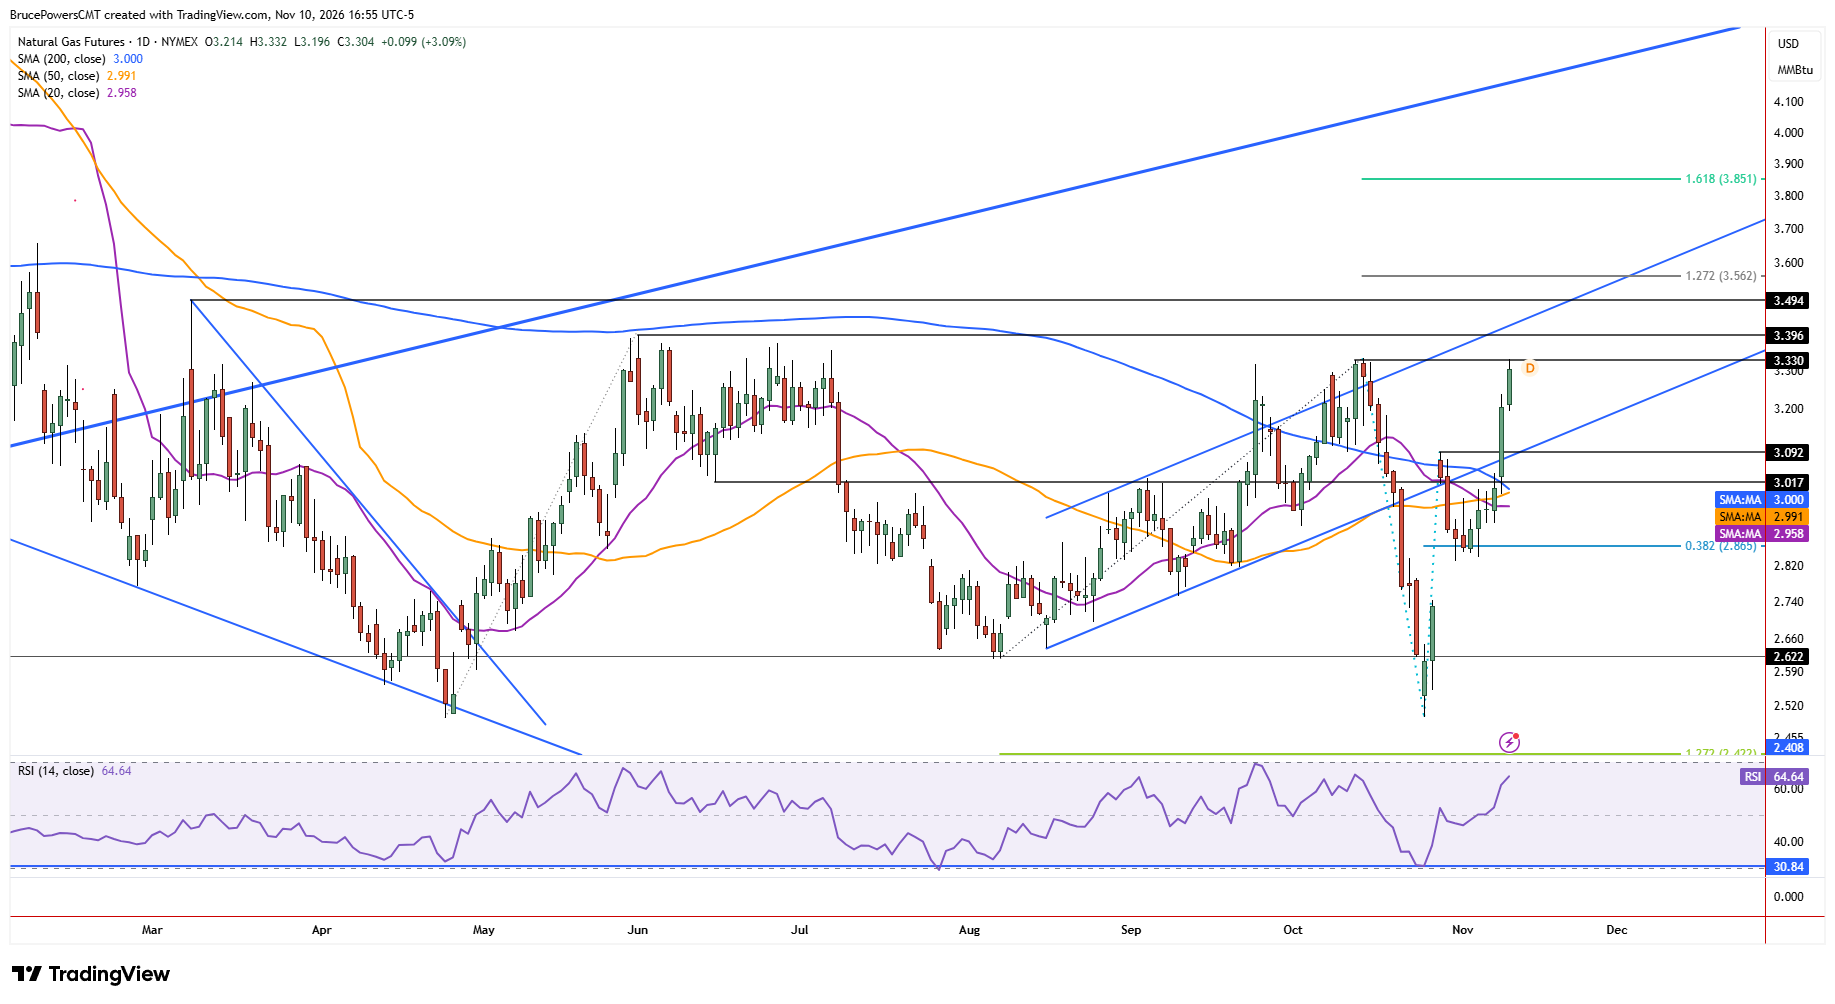
Natural gas extended gains during Tuesday’s session, reaching a high of $3.33 and testing resistance at the October high of $3.33. Buyers remain in control at the time of writing, with a strong daily close in the top quarter of the day’s range likely. Bullish momentum strengthened during Monday’s session with a decisive reclaim of the 200-day moving average near $3.00.
That helped clarify the next potential move, which could have resolved to the downside once testing resistance near the moving average but instead is suggesting that an upside breakout of a large rectangle consolidation pattern could occur instead, thereby opening higher potential targets.
Resistance Zone Tests Current Strength
Nonetheless, bullish momentum is entering its third day as it challenges a significant resistance zone. This suggests that some degree of corrective behavior could assist the success of the next bullish breakout signal, if it is to occur. Meanwhile, resistance could hold for a pullback before resistance is again challenged.
Fourth Attempt Gains Added Significance
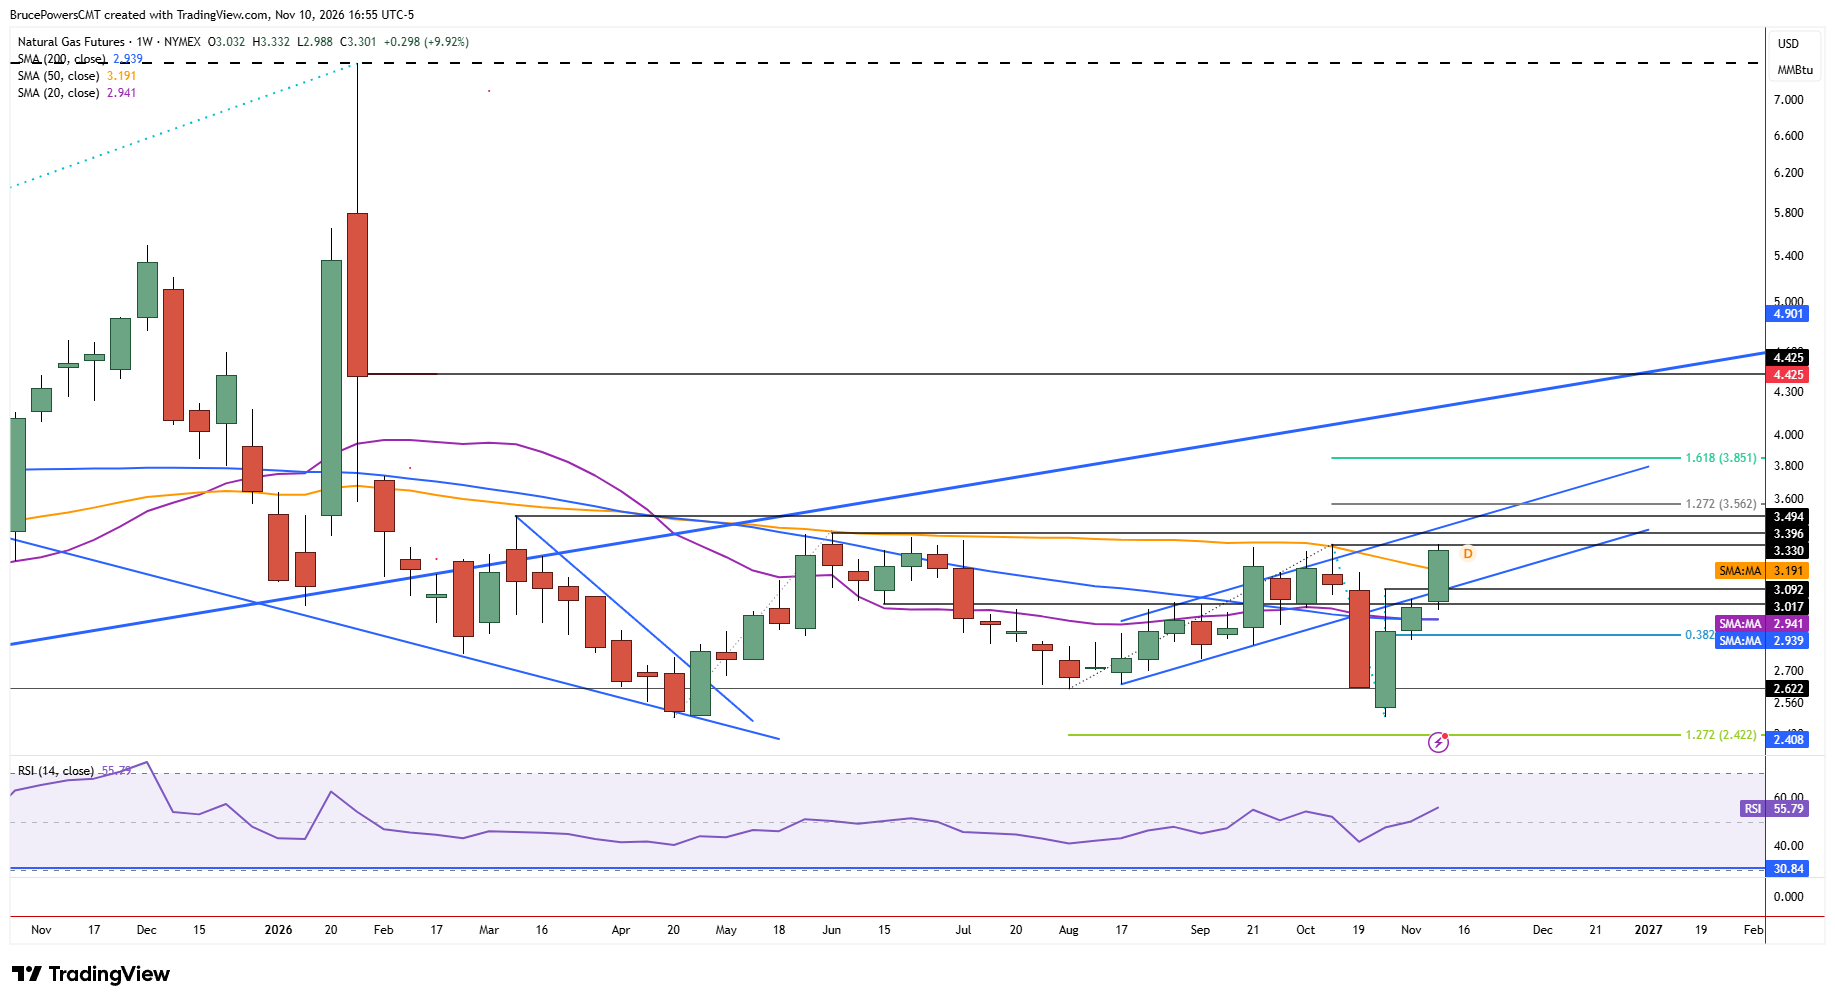
Since this is at least the fourth attempt since February to reclaim the 200-day moving average, the new attempt may have greater success. Notably, the recent low of $2.50 established the lower boundary of the rectangle pattern and it was followed by an aggressive advance to Tuesday’s high. This was the sharpest rise from a low since February, adding to the potential for an upside breakout if momentum can be sustained.
Key Support Levels and Upside Targets
Short-term support is at Tuesday’s low of $3.20, followed by a prior high at $3.09 and those are key levels to watch during weakness. Two successive lower swing highs define initial upside targets if $3.33 is recovered, at $3.40 and $3.49. However, an upside breakout of the rectangle formation would trigger above $3.40, providing a trend reversal signal. The subsequent price rection could be significance if the rectangle pattern has influence.