


Consolidation Holds Despite Wednesday’s Rejection
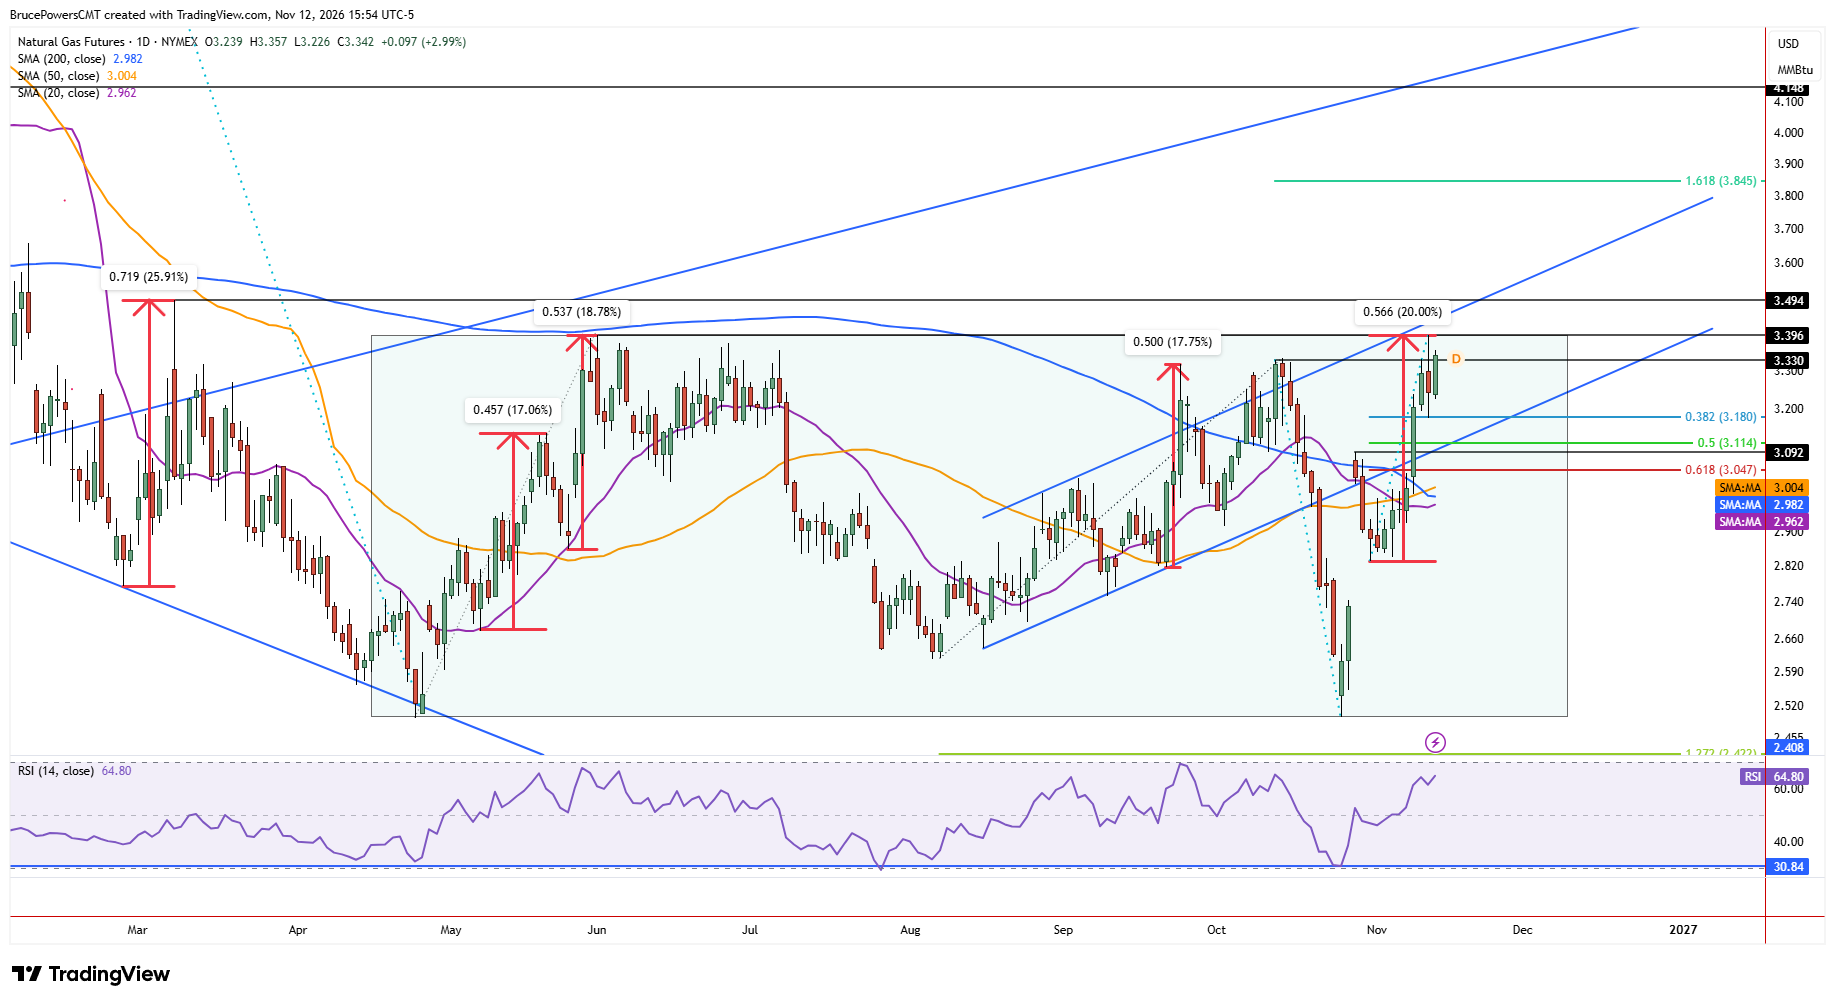
Natural gas consolidated inside the prior session’s range on Thursday, establishing a lower daily high of $3.36 and a low of $3.23. A move through either level may determine the next move, but the bias remains to the upside given the sharp advance that preceded it and the subsequent retention of strength. This consolidation followed a high of $3.40 on Wednesday, where resistance was seen and sellers regained control.
The result was an intraday pullback to a low of $3.18 and the completion of a 38.2% Fibonacci retracement of the prior advance. That low is now key support, and a decline below it would put the 50% retracement at $3.11 in line for a test of support, along with a rising trendline.
Accelerating Momentum Challenges Eight-Month Base
The $3.40 high on Wednesday completed a sharp 20% advance from the prior swing low of $2.83 reached last week. It demonstrates strong bullish momentum that found resistance at the top of a large rectangle consolidation pattern with a high of $3.40 dating back to early June. Notably, the prior two advances since the April lows took over 34 days to reach a high, while the current advance accomplished that in only 12 days. This may be another sign of improving demand, which will be needed if natural gas is going to eventually break out of the rectangle and advance toward higher targets.
Upside Targets Extend Toward $4.15
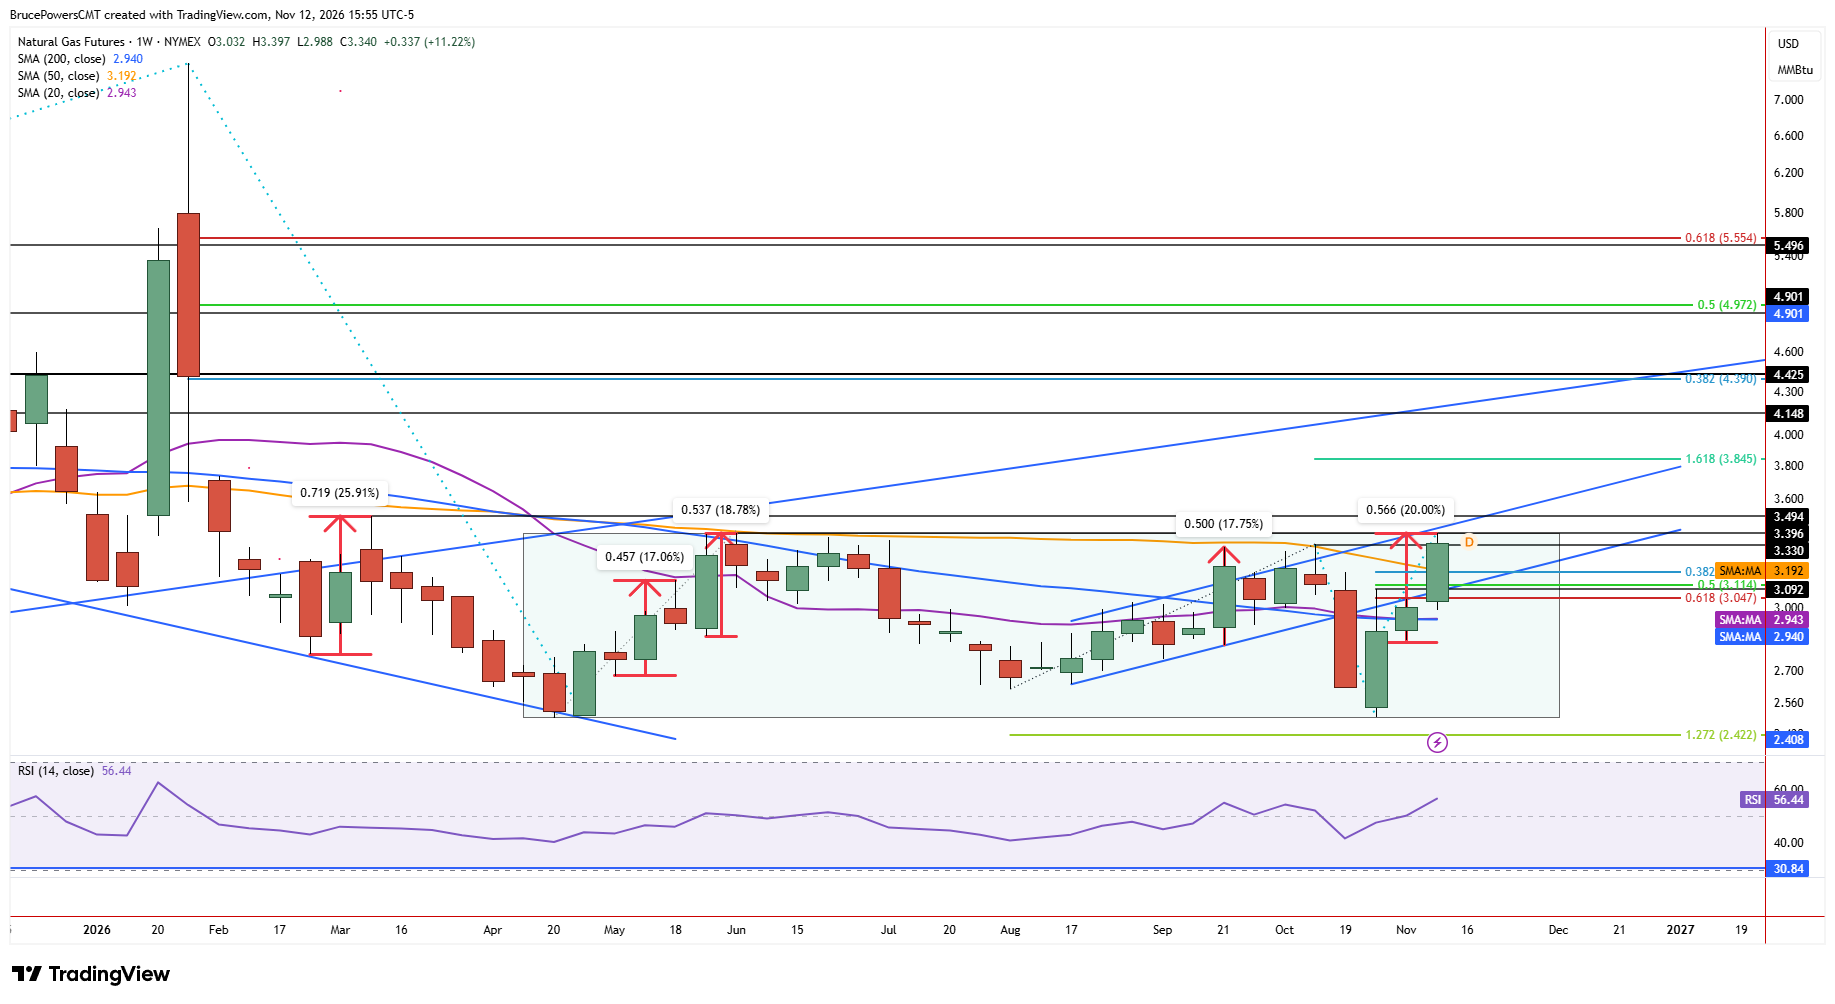
Prior resistance at the lower swing high of $3.49 provides the first upside resistance level, followed by $4.15, which was a peak from March 2025. There is also a less significant, but nonetheless valid resistance level indicated by the 161.8% Fibonacci extension of the recent decline at $3.845.
Long-Term Resistance Holds Key to Breakout
Since the rectangle formed over approximately eight months, an upside breakout could trigger an increase in momentum. Also, resistance near the upper boundary of the formation is reinforced by the 200-month moving average at $3.37. Therefore, a rise above $3.40 would also trigger a reclaim of that long-term moving average, adding to the significance of an upside breakout and providing a bullish reversal signal. Until then, the current consolidation leaves the market testing whether buyers have sufficient strength to overcome this important long-term resistance.
If you’d like to know more about how to trade natural gas, please visit our educational area.