


Bullish Reversal Confirms at Fibonacci Level
Natural gas extended its pullback on Tuesday before finding support at a key Fibonacci retracement level and staging a bullish intraday reversal. A low of $3.05 was reached, thereby completing a 61.8% Fibonacci retracement of the prior advance after failing to hold a support zone near Friday’s low of $3.09.
Buyers regained control from that low and drove prices higher. First, prices recovered above the lower boundary of a rising trend channel before triggering a one-day bullish reversal above Monday’s high of $3.19. That led to a high of $3.24 for the day and a bullish outside day pattern. A daily close above $3.19 would confirm the short-term bullish signal.
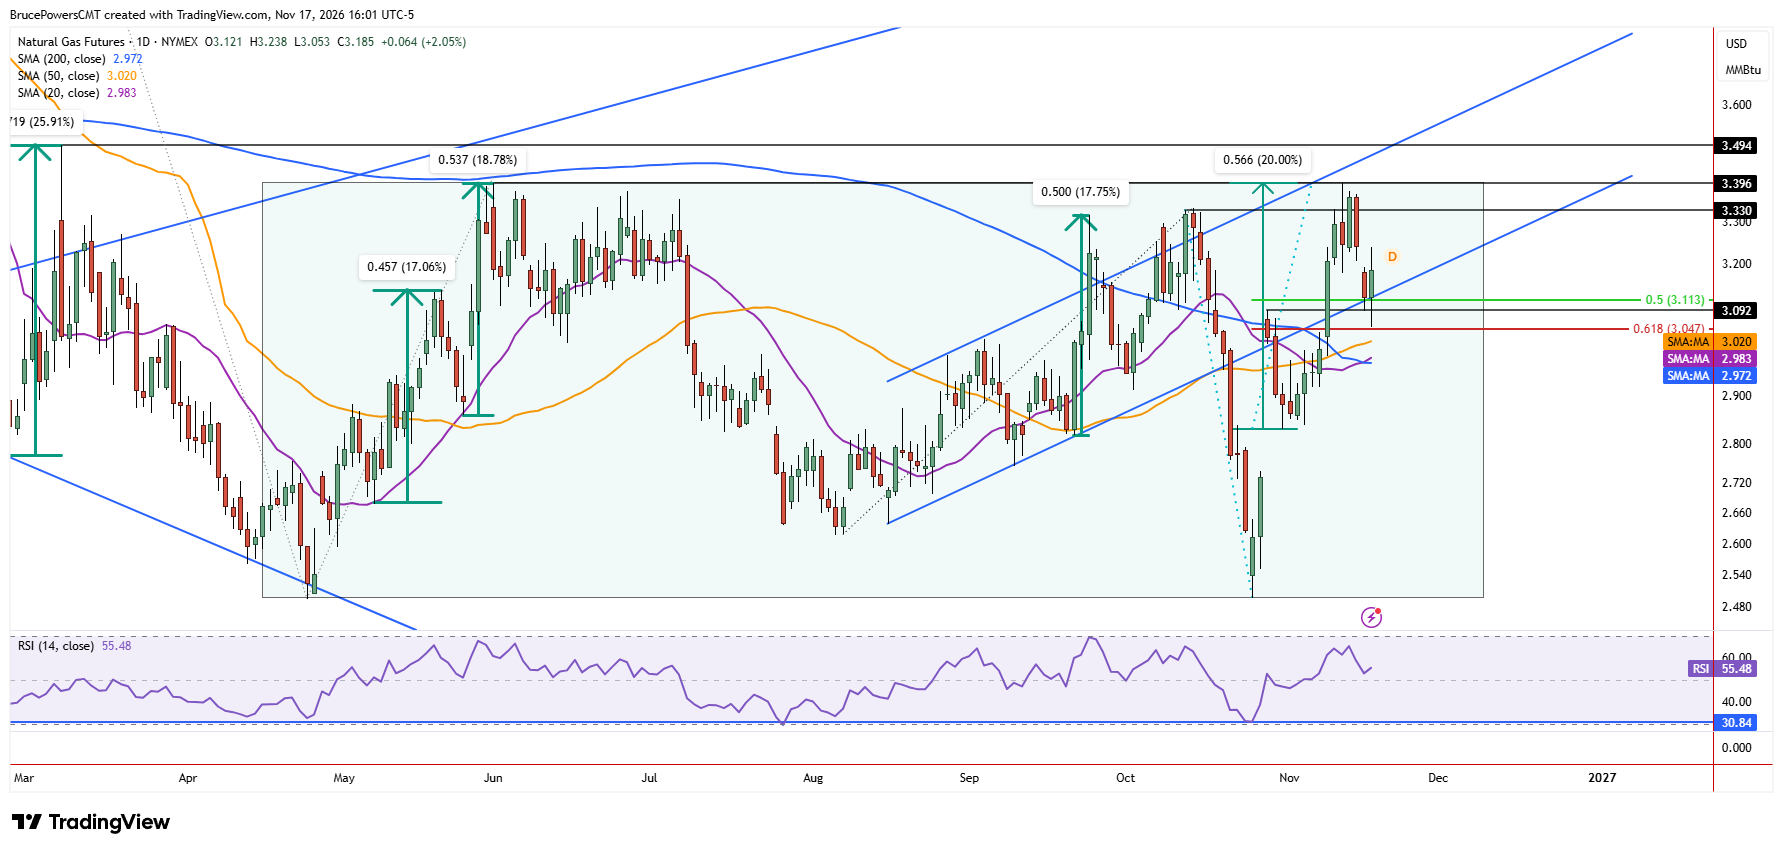
Short-Term Support Established Amid Volatility
This suggests that the current pullback may be complete, and at worst, a key support level may be established at $3.05. Although the lower boundary of the channel was broken to the downside, its quick intraday recovery suggests seller exhaustion and the potential for another leg higher. However, the wide range from $3.05 to $3.24 leaves room for continued volatility before a decisive move occurs through either the Tuesday’s high or the low.
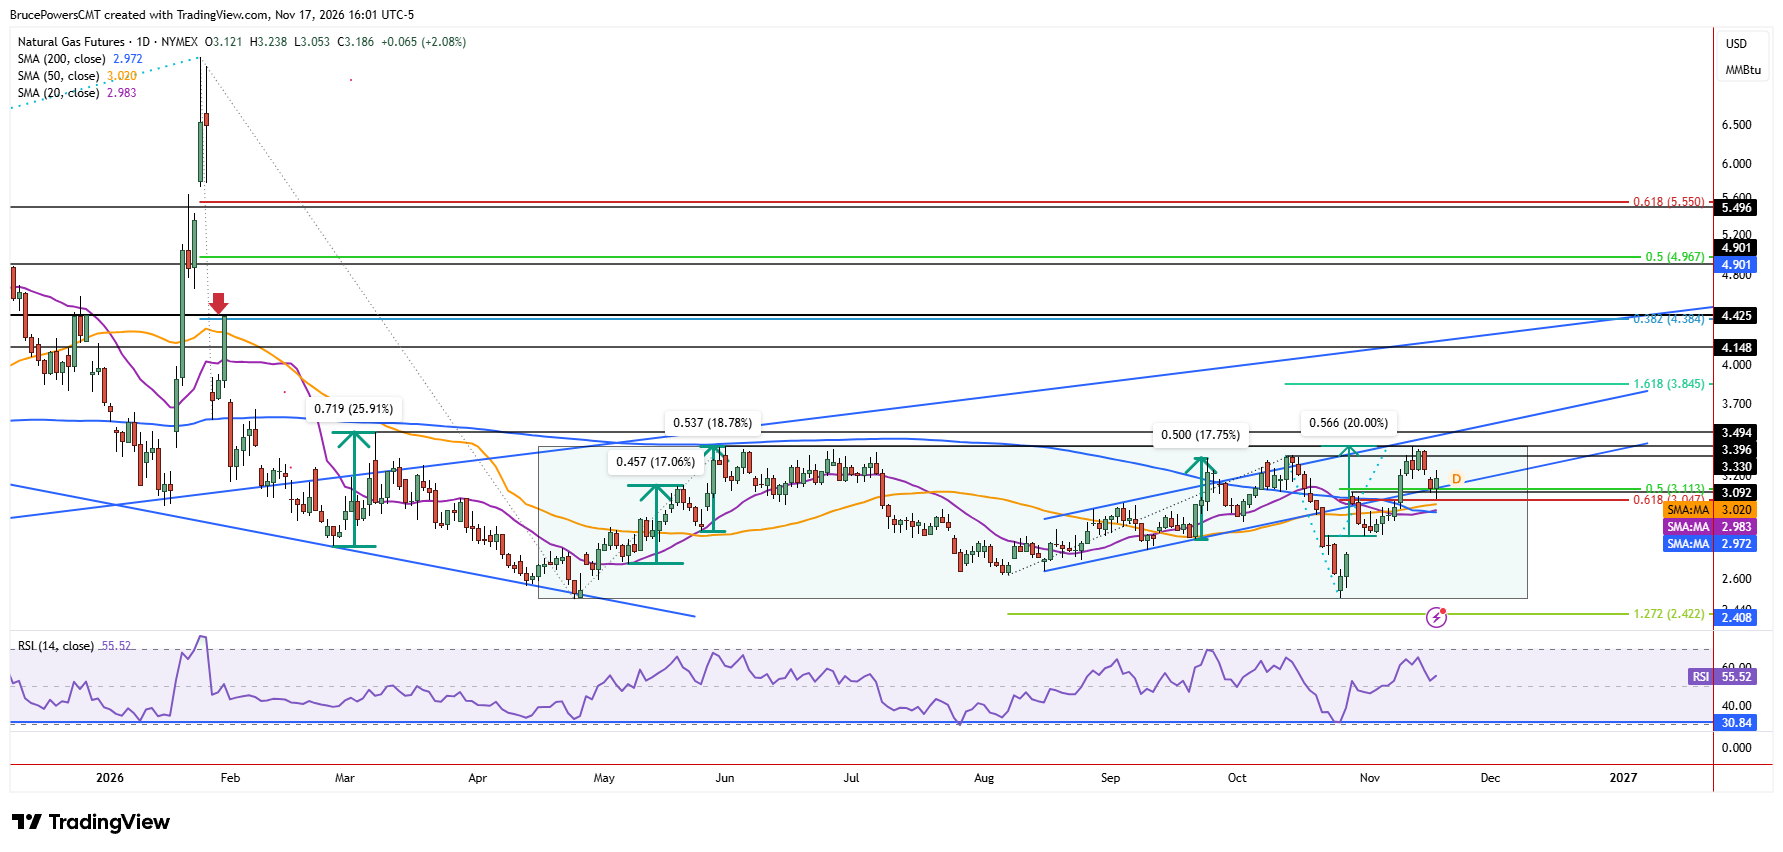
Consolidation Sets Stage for Larger Breakout
With Tuesday’s low, natural gas is set to trade within a range extending up to last week’s high of $3.40. This puts it in a good position to end this week inside last week’s range, reflecting consolidation on that larger timeframe. However, the quick recovery back above the rising channel leaves open the possibility of an eventual upside breakout above $3.40 to remain as a possibility, unless $3.05 fails to hold as support. This suggests that a few days or more of consolidation may follow before the next direction is tested.
Rectangle Pattern Keeps Broader Bullish Case Alive
The $3.40 high marks the top boundary of a large rectangle consolidation pattern that has the potential for an upside breakout that could signal a bullish reversal in the declining trend that followed the spike peak of $7.44 from January. Even a short period of consolidation would help build demand for an upside breakout, as the key question is whether natural gas can sustain its advance toward and eventually above $7.44. Holding above the newly established $3.05 support would help keep that broader bullish possibility alive.
If you’d like to know more about how to trade natural gas, please visit our educational area.