


Rally Loses Momentum at Key Resistance
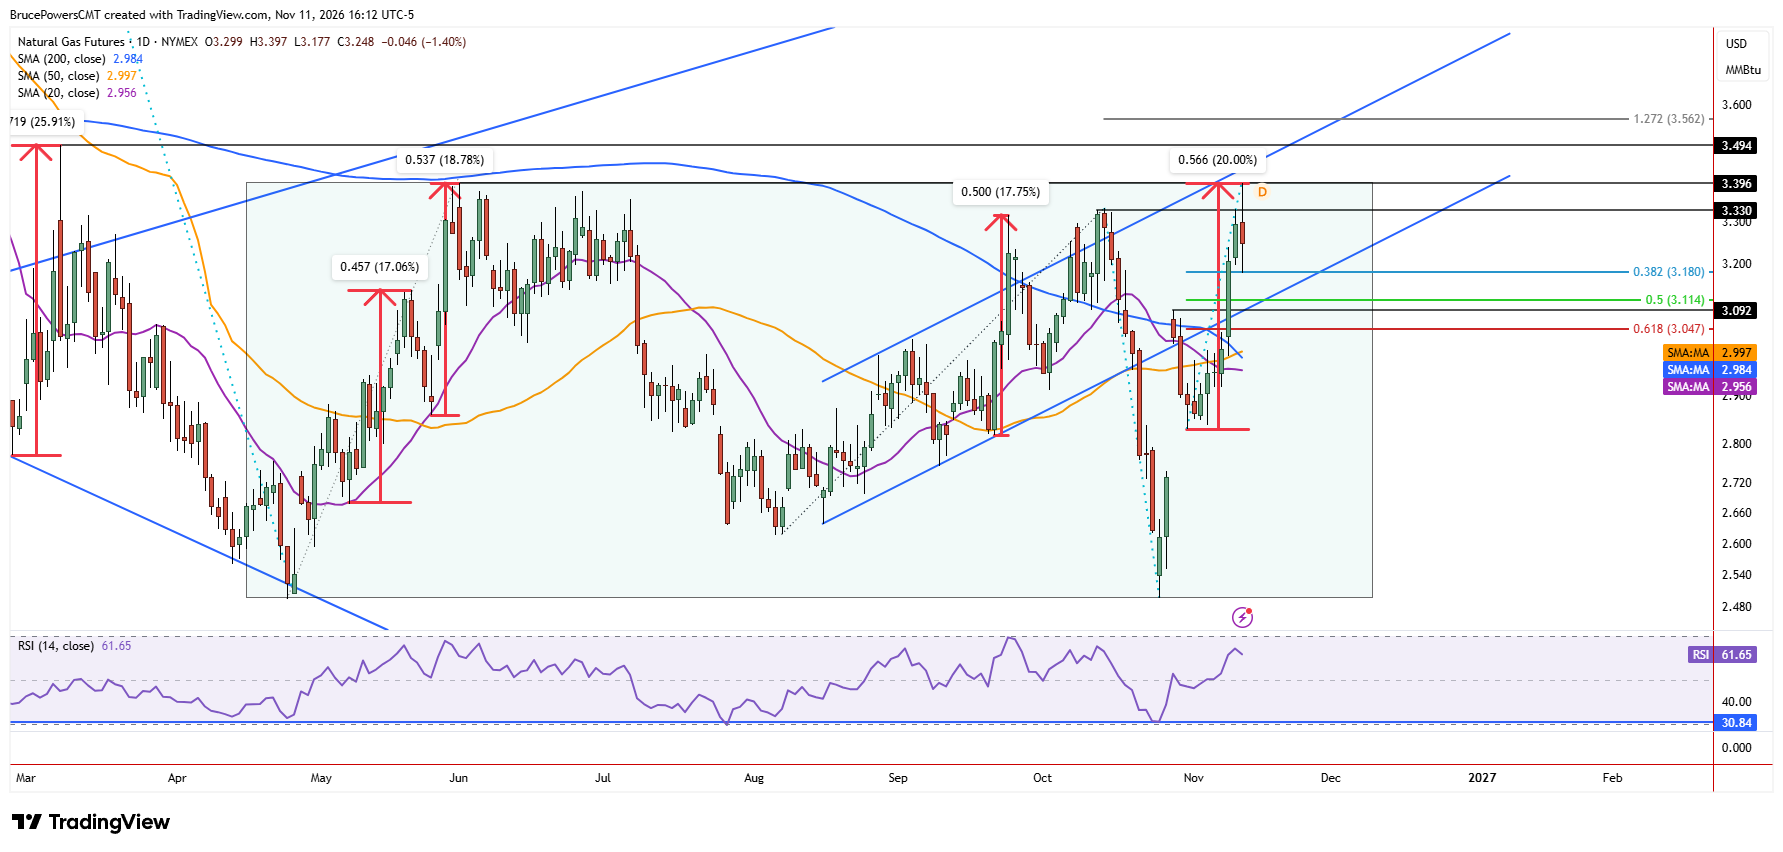
Natural gas initially extended gains on Wednesday, testing a key resistance target with a high of $3.40, before sellers took control and pushed prices lower. At the time of writing, trading continues near the lows of the session, currently $3.19. This creates the potential for a bearish shooting star candlestick pattern, which would not be confirmed unless prices break below Wednesday’s low.
As of Wednesday’s high, natural gas had risen around 20% from the recent swing low of $2.83. The current upswing was the largest advance of the prior advance since the March 2026 peak at $3.49. This suggests improving underlying demand and strengthens the larger potential bullish pattern. However, in the short term, a pullback to test support may follow before another attempt to extend the advance that followed the recent low of $2.50 in October.
Rectangle Pattern Holds Larger Bullish Potential
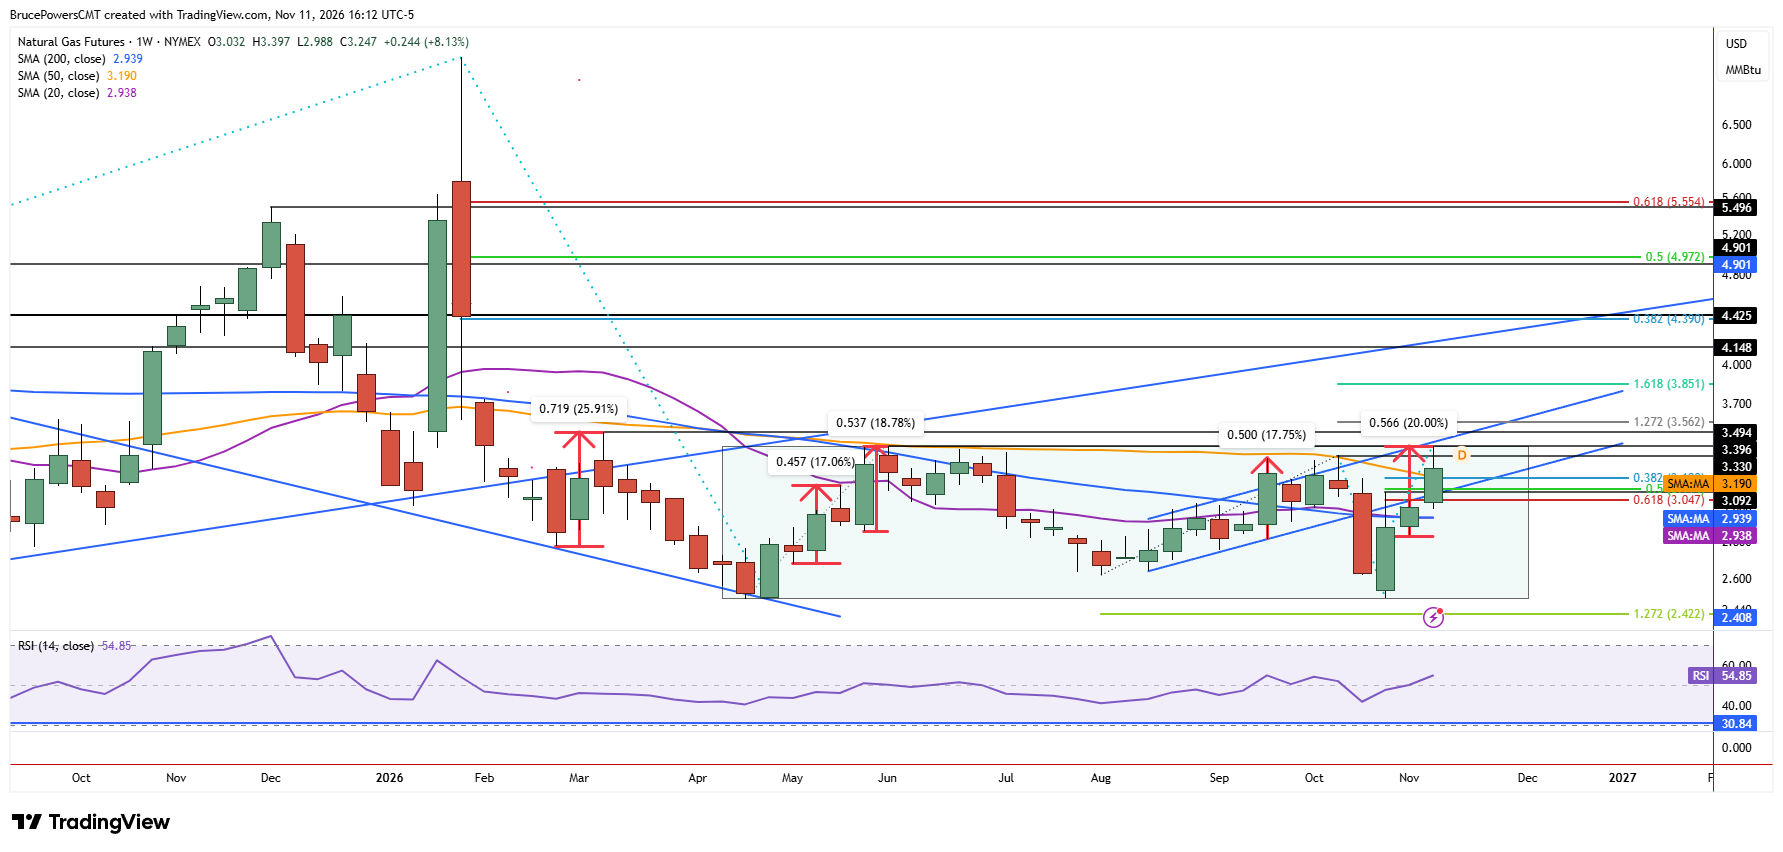
Resistance was seen at the lower swing high of $3.40 from early June, which marks the top boundary of a large rectangle pattern that has formed since the April low. Since the consolidation pattern occurs near trend lows, relative to the January peak of $7.44, it suggests the possibility of a bullish reversal signal on a decisive rally above $3.49. That would signal a breakout of the rectangle and provide additional confirmation of a potential bullish reversal, putting natural gas in a strong position to challenge higher resistance targets.
Fibonacci Support Levels Define Pullback Risk
Consequently, a decline below Wednesday’s low will signal a pullback from key resistance. If underlying demand remains strong, the pullback should be relatively shallow. Key levels to watch for support start with the 38.2% Fibonacci retracement of the prior advance at $3.18, followed by a 50% retracement at $3.11. However, unless the 50% level is tested in the next few days, a break below the rising trendline at the lower boundary of the trend channel would need to be broken to reach the 50% retracement level.
Trendline Test Determines Next Direction
Therefore, the magnitude of the current pullback and subsequent recovery are important in determining what happens next in the bigger picture. A decisive decline below the trendline could result in a failure of the developing bullish structure and provide another bearish signal. Otherwise, once support is established and followed by another advance, it could result in a bullish reversal signal against the long-term decline on a breakout above $3.40.
Higher Targets Await Breakout Confirmation
Some of the more obvious upside targets begin with $3.49, $3.56, and $4.15. Since $4.15 is below a long-term rising trendline, it would seem to have a reasonable possibility of being tested following a confirmed breakout. For now, Wednesday’s rejection at $3.40 makes the coming pullback important, but the larger bullish opportunity remains intact as long as key support holds.
Natural Gas Price Forecast
Every new Natural Gas analysis as it publishes, today's technical signal and key levels, live price — on one page.
See all Natural Gas forecastsIf you’d like to know more about how to trade natural gas, please visit our educational area.