


Rectangle Breakout Puts $3.40 Resistance to the Test
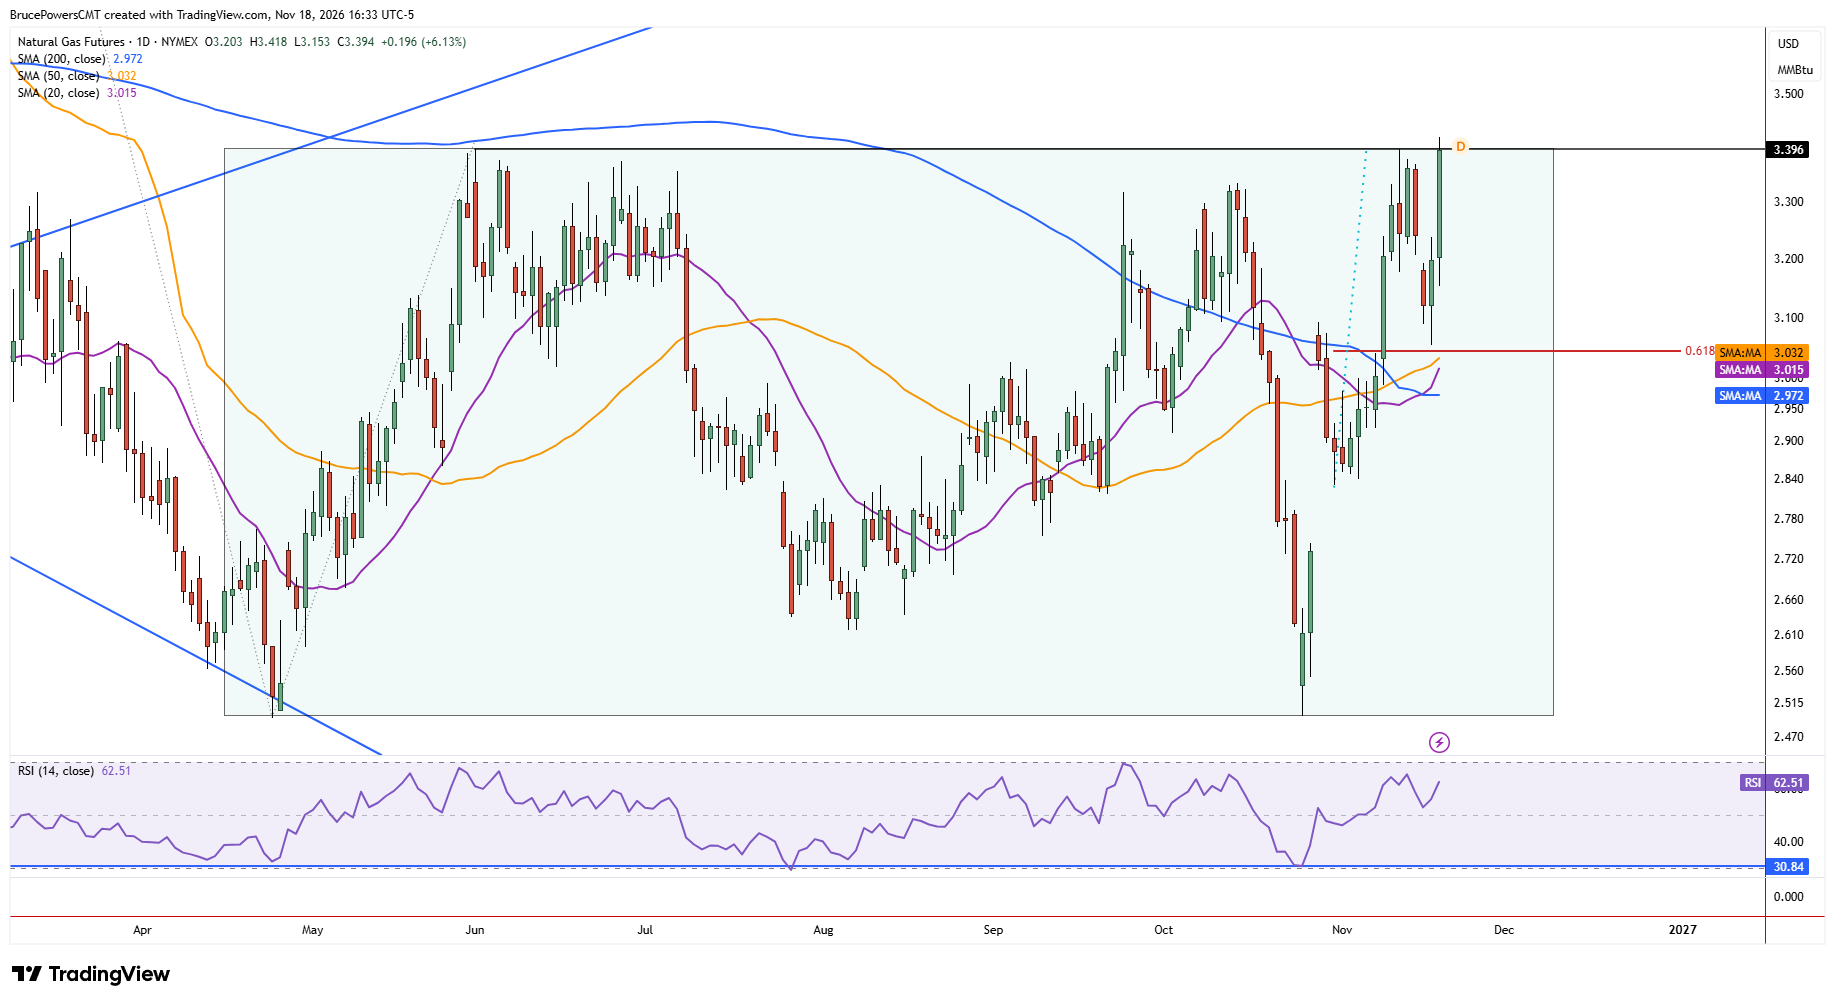
Natural gas continued to strengthen on Wednesday, rising to a new recent high of $3.42 and triggering an initial breakout signal for a large rectangle consolidation formation. The top of the pattern is at $3.40, which was confirmed with last week’s high to the same level. A pullback followed that high this week and support was found near the 61.8% Fibonacci retracement of the prior advance on Tuesday of this week. That level is now a higher swing low and a key support level. A close above the prior high of $3.40 would confirm the long-term bullish breakout.
200-Day Moving Average Reclaims Its Bullish Role
Although Wednesday’s advance needs further confirmation of strength, the advance generated a long-term bullish reversal signal from the rectangle pattern and a continuation signal for the short-term trend that began from the recent low of $2.50. That low established the lower boundary of the rectangle. This week’s pullback and subsequent higher swing low were part of a successful test of support near the 200-day moving average, further validating the reclaim of that average on November 9. That switch from dynamic resistance to support is bullish price behavior, especially since it has been followed by a long-term bullish reversal signal.
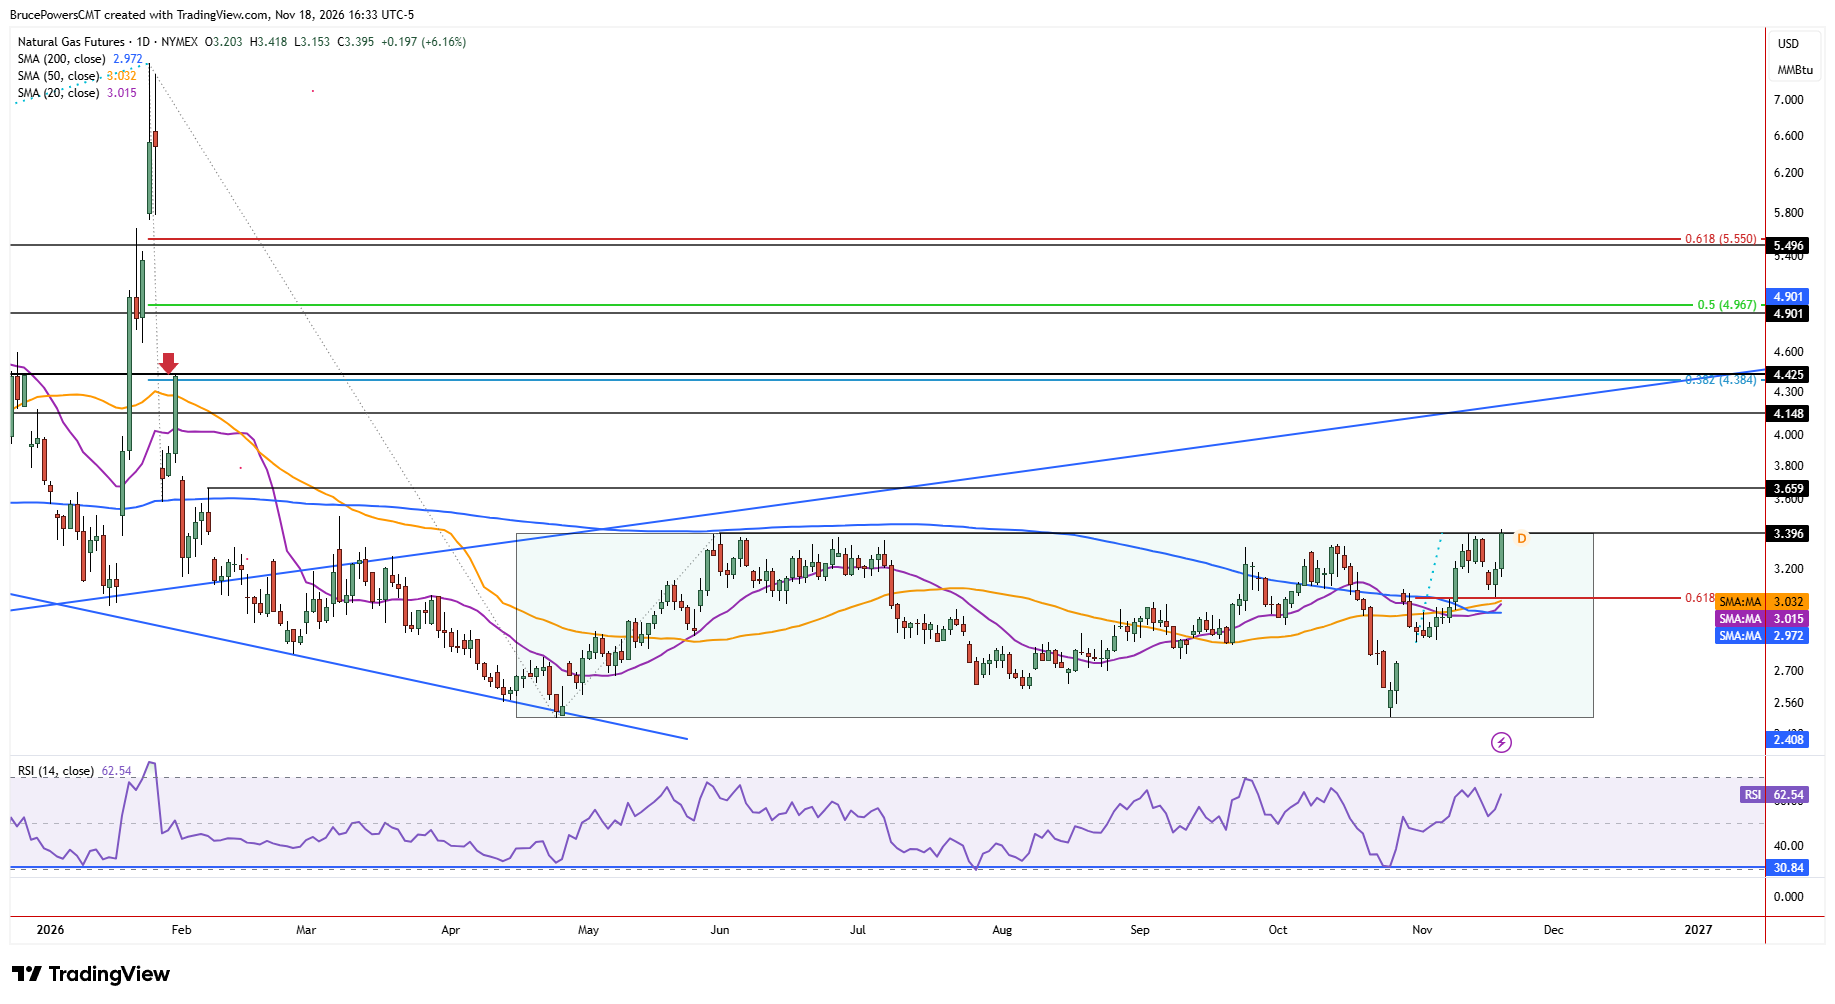
The 200-day moving average has defined a rough dynamic resistance area since natural gas broke below it in February. A couple of recent attempts to reclaim the 200-day moving average failed, but given the successful test of support near that average and subsequent advance on Wednesday, it becomes a key support indicator and reinforces the potential of the rectangle breakout.
Higher Resistance Targets Come Into Focus
An initial upside resistance target has been raised to the interim swing high of $3.66 from February, with prior swing highs at $4.15, $4.43, and $4.90 provided higher potential targets. Short-term support is Wednesday’s low of $3.15, followed by the $3.05 swing low. Support near that low is not only reinforced by the 200-day moving average near $2.97, but also by the nearby 50-day and 20-day moving averages.
If you’d like to know more about how to trade natural gas, please visit our educational area.