


Buyers Respond at Critical Support
Natural gas fell to a slightly lower corrective low of $2.73 on Thursday, before finding support and bouncing, suggesting that buyers may be defending a key support. Support may hold near the higher swing low of $2.75 and the 78.6% Fibonacci retracement of the prior advance at $2.77.
A rising trendline reinforced support. The decline also briefly reversed the prior advance by breaking below the higher swing low at $2.75 from September. That might have temporarily exhausted sellers since Thursday’s session is on track to recover that low and close above the prior low of the trend from Wednesday at $2.77 and above the Fibonacci level. Each signal provides evidence of short-term strength.
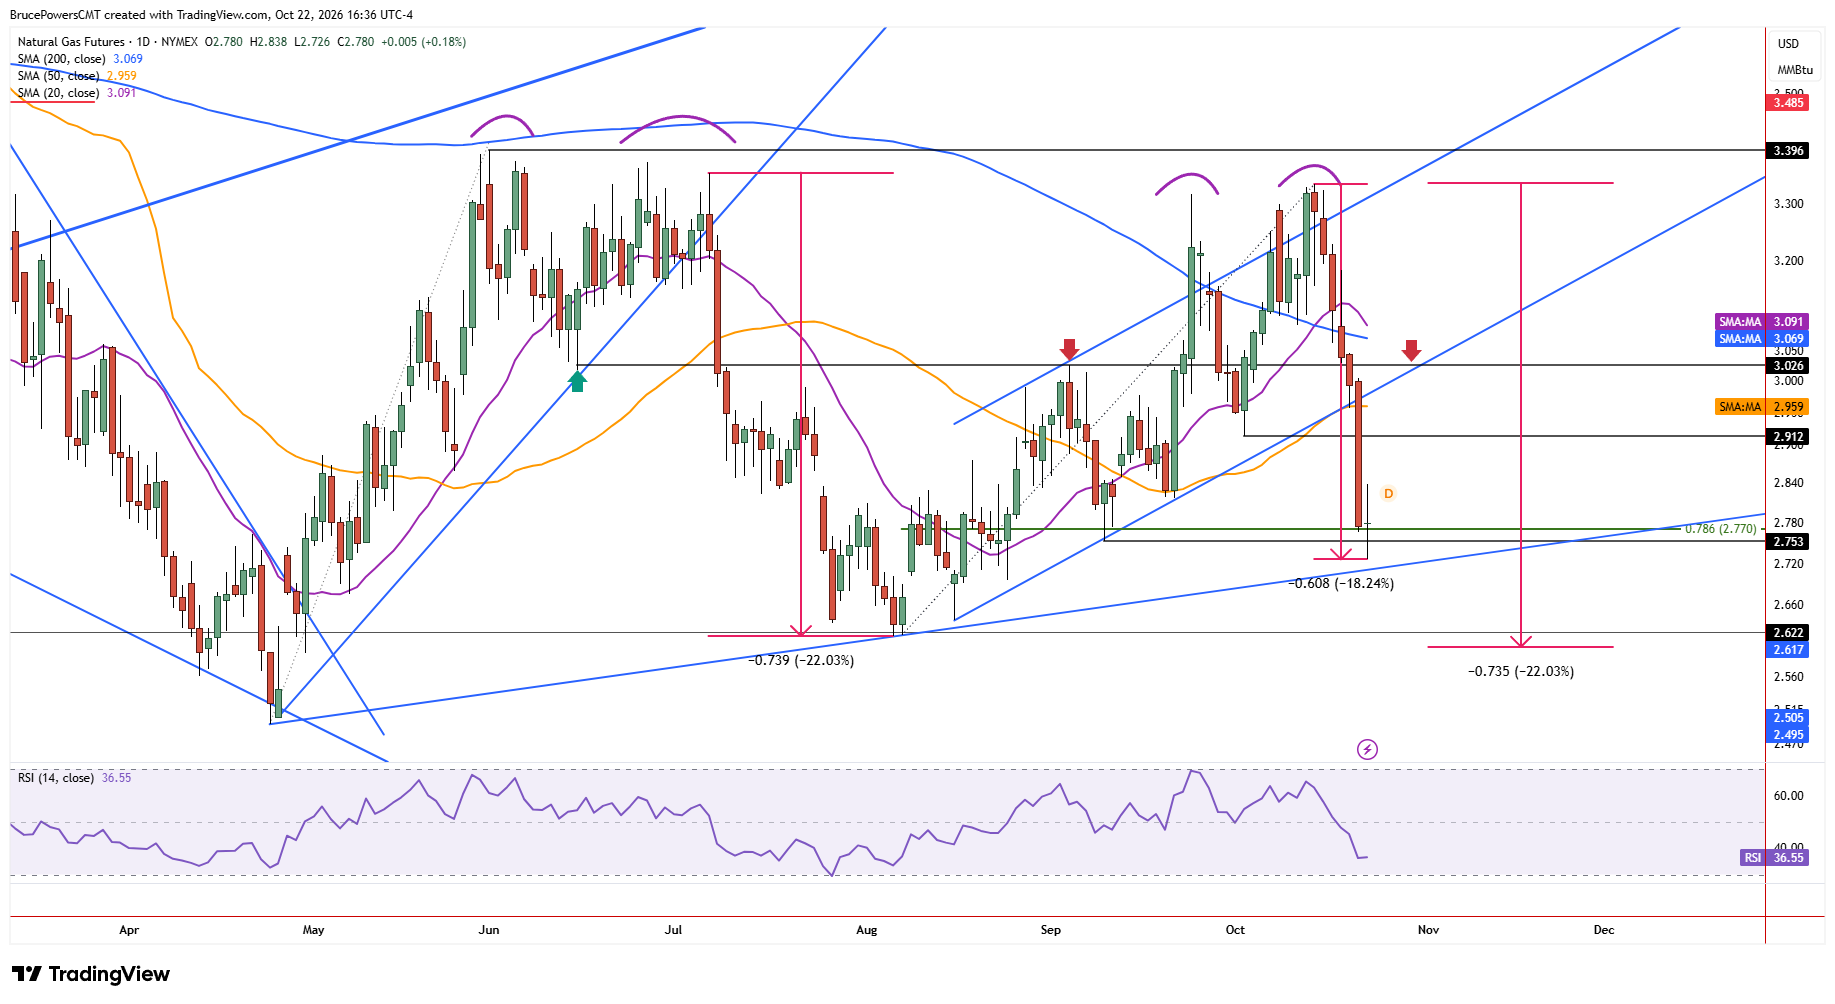
$2.84 Breakout Offers First Bullish Signal
There has not yet been a pullback following the decisive breakdown below a rising channel and the 50-day moving average, to test prior support as resistance. If support continues to hold above Thursday’s low, a one-day bullish reversal signal will trigger on a move above the session’s high of $2.84. Possible upside resistance targets would then include the higher swing low of $2.91, the 50-day moving average near $2.96 and a structural level around $3.03. Higher up is possible resistance near the 200-day moving average at $3.07.
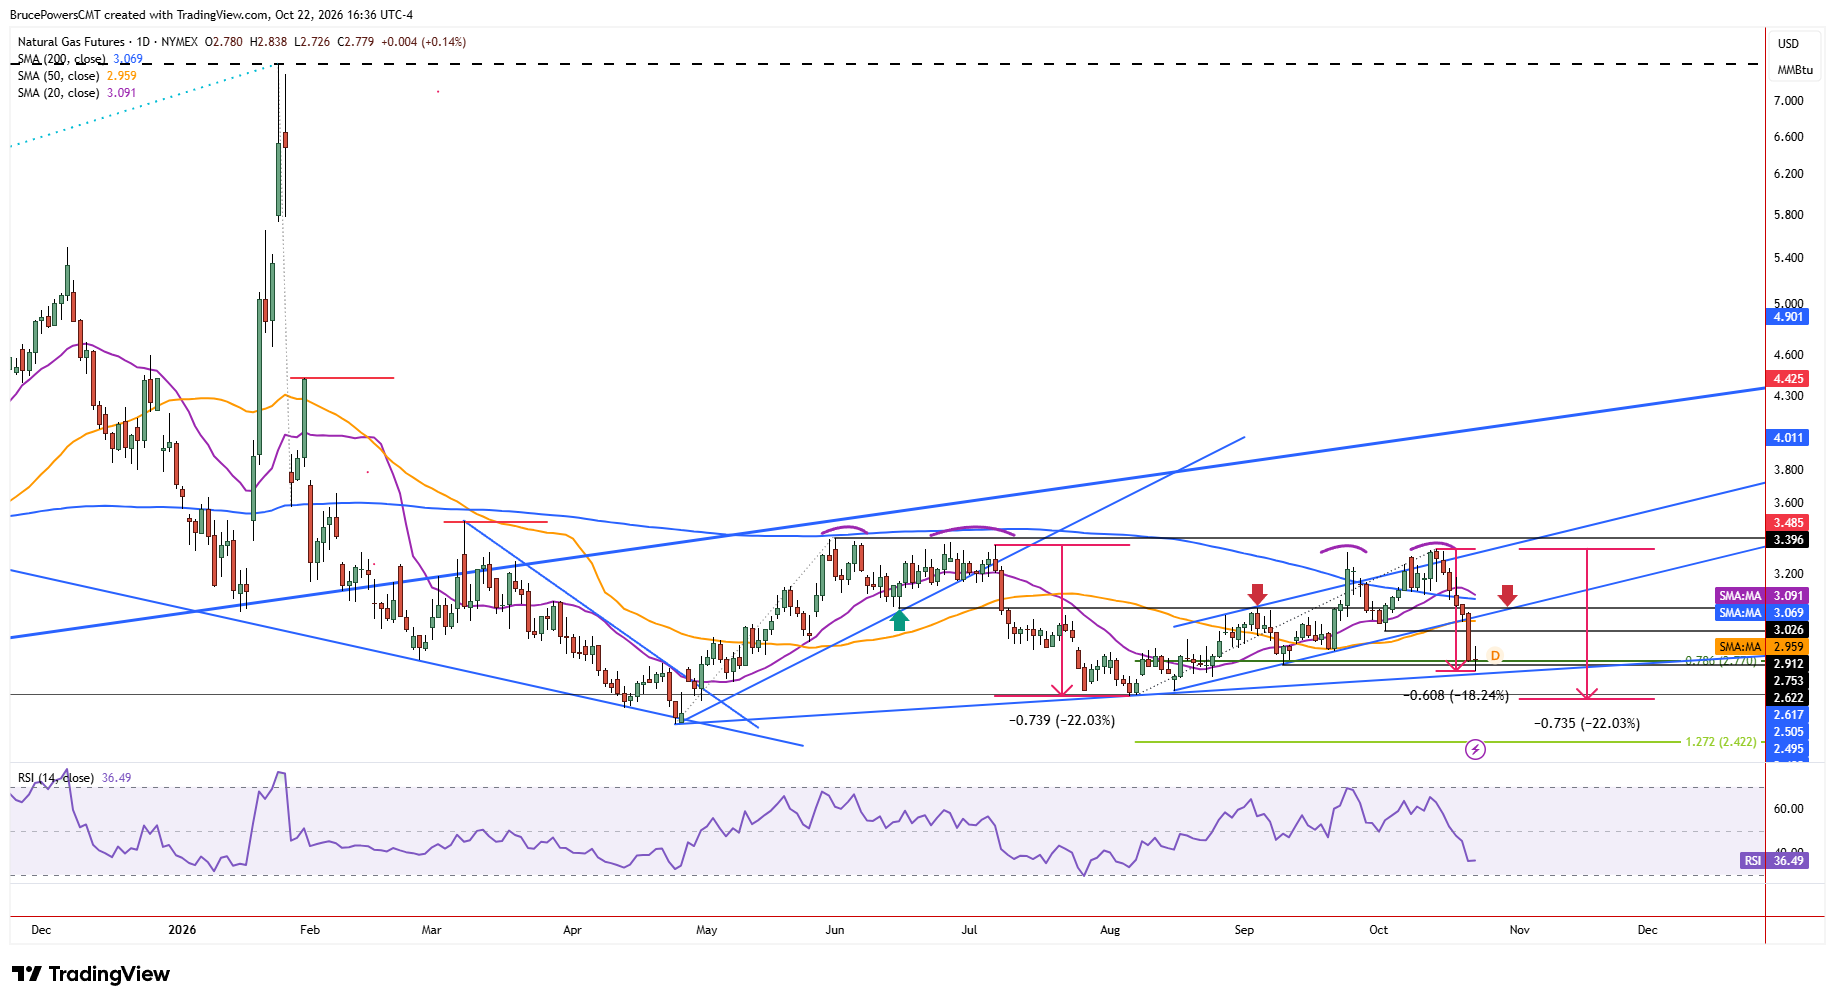
Longer-Term Resistance Keeps Sellers in the Picture
Although a bounce could develop, the recent failure at the 200-day moving average remains a significant bearish factor. Given its long-term nature, that moving average represents an important potential resistance target if buyers take back control, resulting in a rally. The higher swing low of $2.91 is also the neckline of a double top pattern, and a break below that level would validate the pattern, adding to the potential for further downside after a rally and test of resistance. It followed an earlier double top that formed near the June high and led to a sharp decline.
Recovery Faces a Bearish Technical Structure
The breakdown from the rising channel, the rejection at the 200-day moving average and the subsequent lower swing high add to overall downward pressure. Consequently, although Thursday’s bounce suggests that support may be developing near $2.75-$2.77, a recovery into overhead resistance could attract renewed selling. A failure to sustain the rebound would reinforce the bearish outlook, while a move above $2.84 would provide the first signal of short-term strength.
If you’d like to know more about how to trade natural gas, please visit our educational area.