


Channel Breakdown Accelerates Selling Pressure
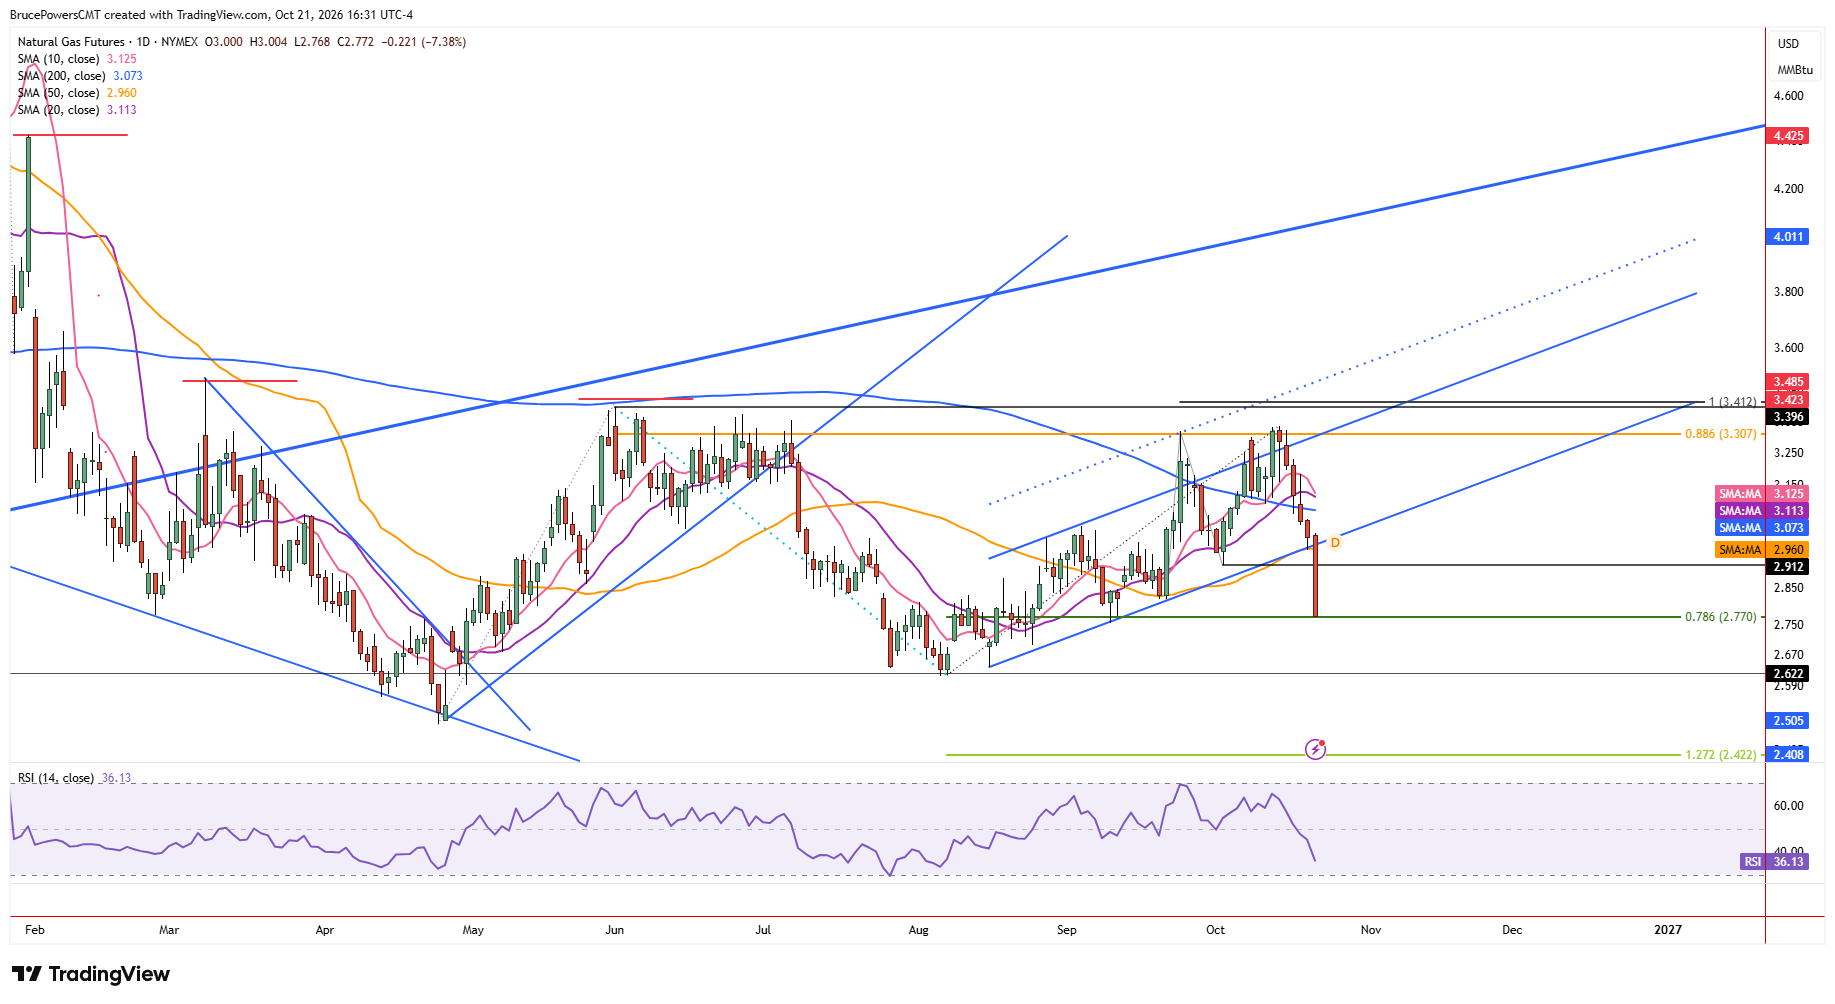
Natural gas fell sharply on Wednesday to a low $2.77, after triggering a breakdown from a rising channel earlier in the session. Support near the channel was reinforced by the 50-day moving average, which was aligned with the lower boundary of the pattern, and Tuesday’s low of $2.96. Therefore, the reaction to the failure of support has been decisive. At the time of writing, trading continues near the lows of the session, and a 78.6% Fibonacci retracement completes was completed at $2.77.
$2.96–$3.00 Becomes Key Resistance
Although the Fibonacci area is a potential support zone, the likely weak close for the session will keep downward pressure on and the potential for a bearish extension. Given the wide trading range on Wednesday, a bounce from the low could result in more than a few days of trading inside the day’s range, staring with a lower daily high of $3.00. That high can be combined with Tuesday’s low of $2.96 and the 50-day moving average near $2.96, to generate a key resistance zone from $2.96 to $3.00.
Failed Rally Revives Downside Risk
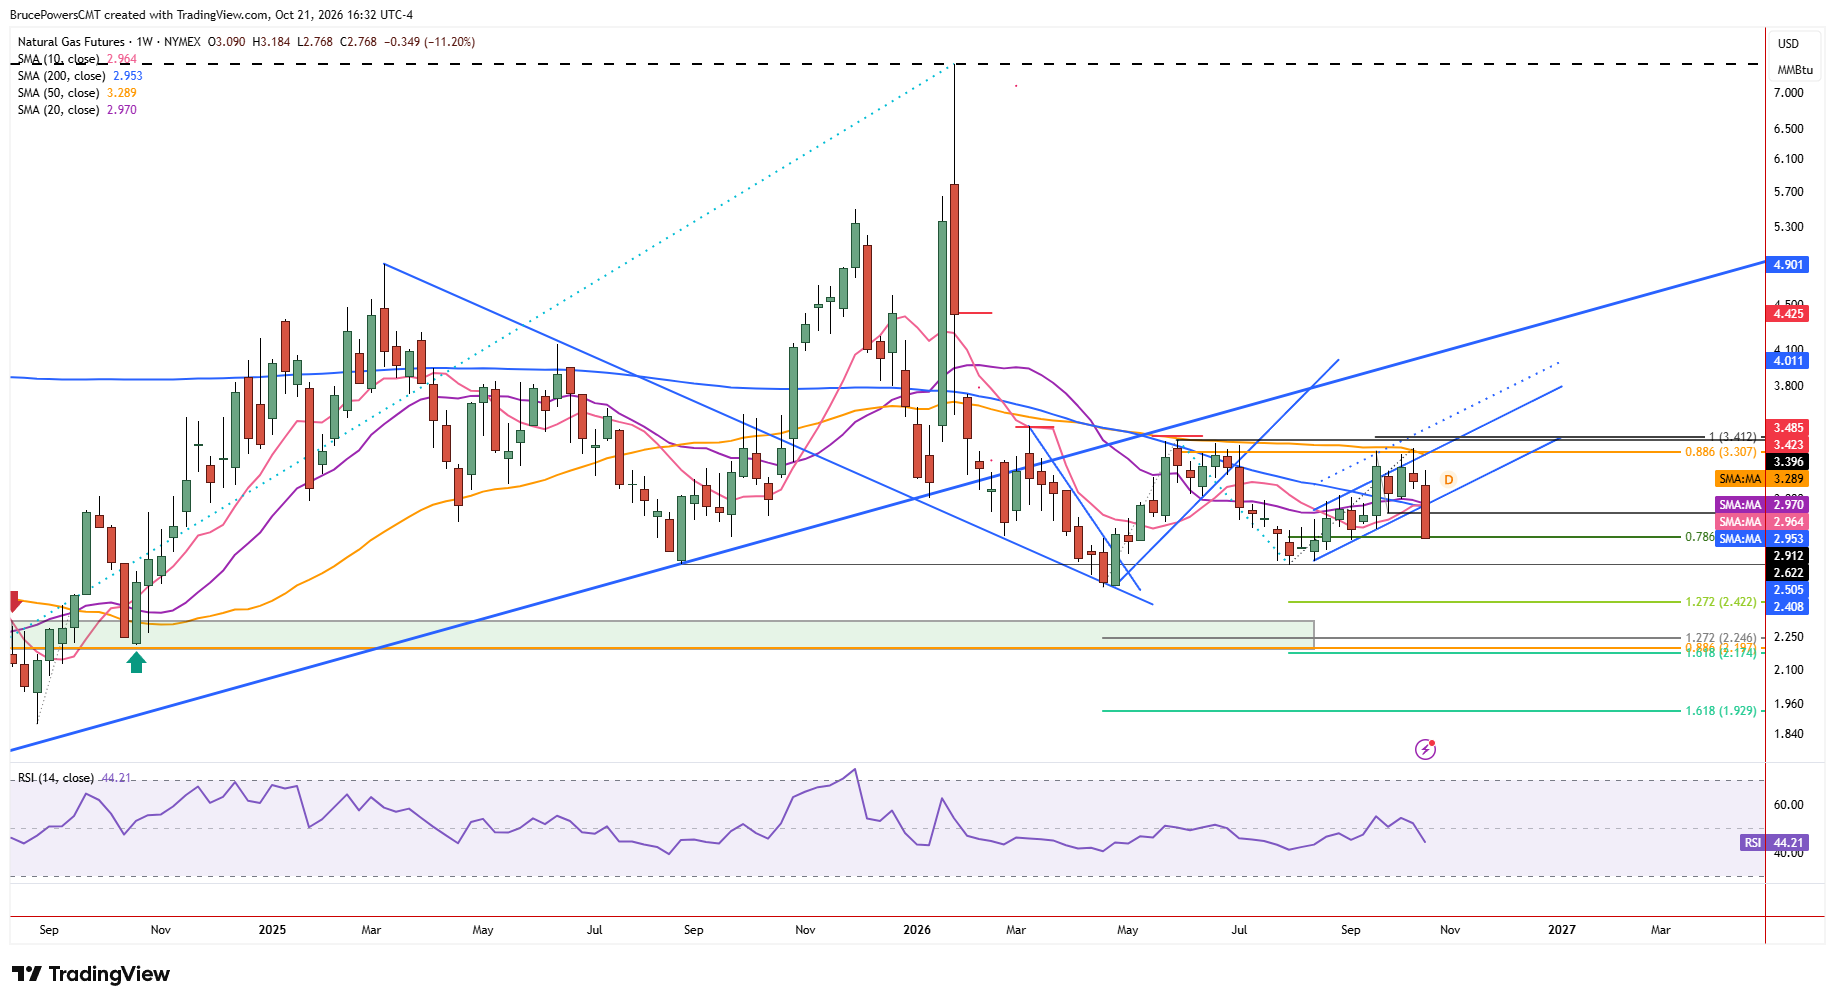
The breakdown signaled the possible continuation of the larger bearish trend. It resulted in the completion of a countertrend advance that confirmed resistance near the 200-day moving average. The recent lower swing high of $3.33 is a bearish indication, suggesting that the recent higher swing low of $2.62 may be at risk of being broken.
Oversold Conditions May Fuel a Bounce
Since the latest rally to a high of $3.33 has failed, a sharp move in the other direction becomes possible. Wednesday’s bearish price action may be the beginning of such a move. However, the wide range on Wednesday suggests a decent bounce if support holds and it is followed by strength. So, natural gas may be short-term oversold, but it has made a change with the new bearish breakdown.