


Breakdown Below Confluence Support
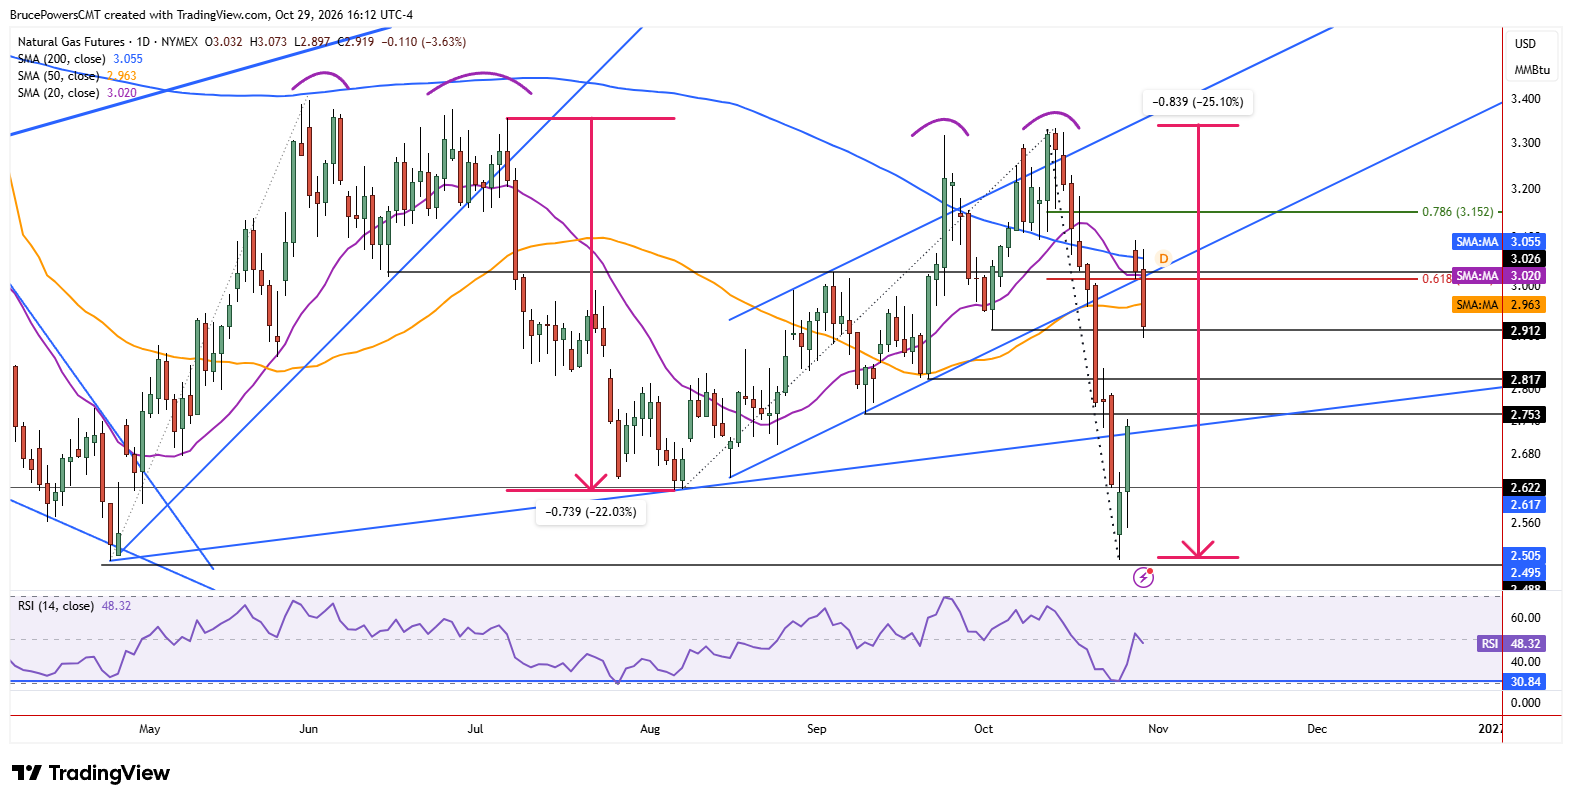
Natural gas declined to a low of $2.90 on Thursday, following a successful test of resistance near the 200-day moving average the day before with a high of $3.09. A bearish signal triggered below a confluence support zone that included Wednesday’s low of $3.01, a lower rising channel boundary, and the 20-day moving average, which was recognized as support with Wednesday’s low and now potential resistance. A new lower daily high of $3.07 is short-term resistance and shows downward pressure along with the lower daily low.
Echo of Last Week’s Sharp Decline
This is a similar breakdown pattern to what was seen during last Wednesday’s sharp decline below the confluence of several indicators, including the prior day’s low of $2.96, the lower channel boundary, and the 50-day moving average rather than the 20-day moving average.
Although there could have been signs of support near the 50-day moving average during Thursday’s session, it broke natural gas broke below it and extended the decline to support at $2.90, which is near the higher swing low of $2.91 from early October. Another bearish indication would occur if natural gas closed below the 50-day moving average.
Sellers Eye Continuation Toward Lower Levels
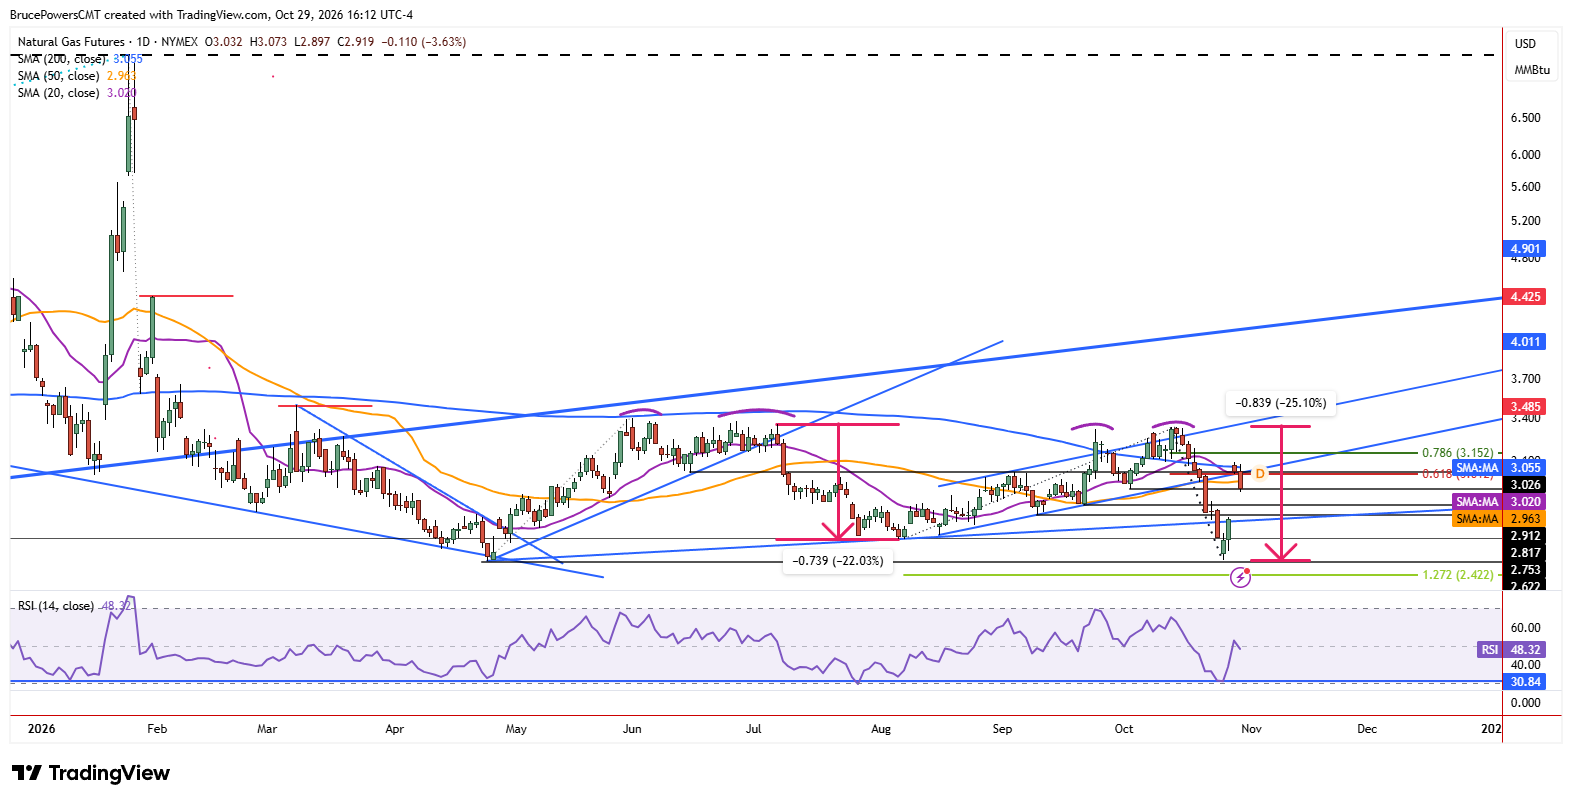
A decline below daily support near $2.90 signals the likely continuation of the pullback from Wednesday’s high of $3.09. The two recent breakdowns from confluence support zones, combined with a likely close below Thursday’s broken support near $3.01, suggests sellers may test lower levels before the decline finds sustainable support. Nonetheless, a bounce to test prior support as resistance may occur first, with a key resistance zone from around $3.01 to $3.07.
Support Targets and Upside Alternative
For now, the expectation is for lower support levels to be tested either before or after a bounce. The next two lower support targets are defined by a higher swing low at $2.82 and another higher swing low at $2.75. After that, last week’s low of $2.62 becomes a potential target. Alternatively, a rally above $3.09 could lead to test of resistance near the 78.6% Fibonacci retracement at $3.15.
Natural Gas Price Forecast
Every new Natural Gas analysis as it publishes, today's technical signal and key levels, live price — on one page.
See all Natural Gas forecastsIf you’d like to know more about how to trade natural gas, please visit our educational area.