


200-Day Moving Average Caps Rebound
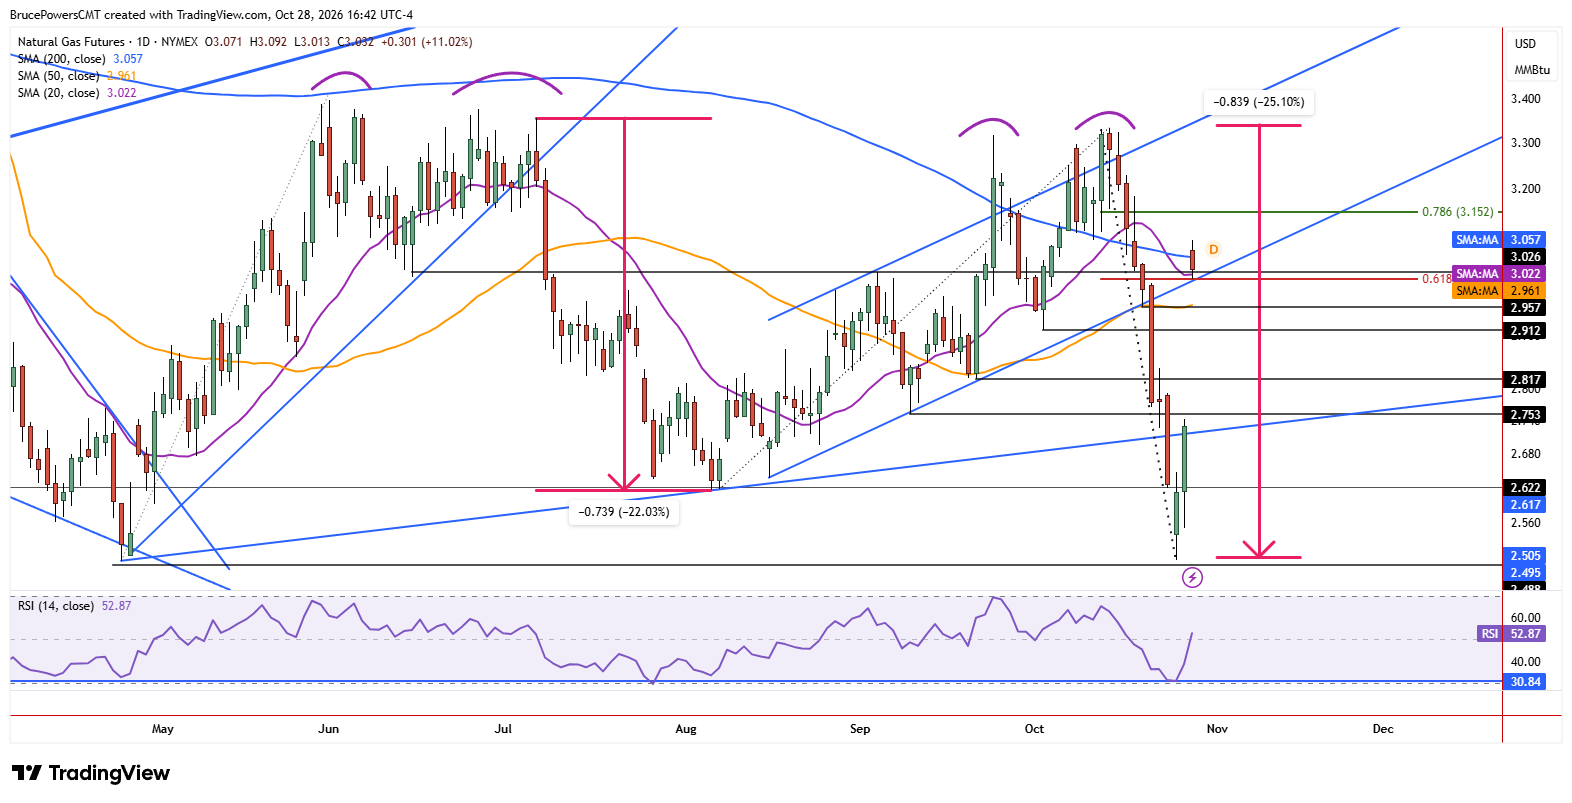
Natural gas jumped to a high of $3.09 on Wednesday following the front month contract rollover to December. Resistance emerged near the 200-day moving average, a key pivot area given its long-term significance and previous failed attempts to reclaim the average during prior rallies in 2026. Sellers took back control following the high and trading remains near the session low, currently at $3.01.
This puts a potential test of support near the 50-day moving average at $2.96 on the horizon, along with the recent daily low at the same level. That represents a key pivot zone since a drop below it triggered a breakdown following the prior advance. Lower potential support levels include prior swing lows at $2.91, $2.81, and $2.75.
Double Top Puts Bulls on Alert
Another test of resistance near the 200-day moving average suggests natural gas could attempt to reclaim the average again and approach the 78.6% Fibonacci retracement of the prior decline at $3.15. A bearish double top pattern has formed at the recent highs, and natural gas is now back within the consolidation range.
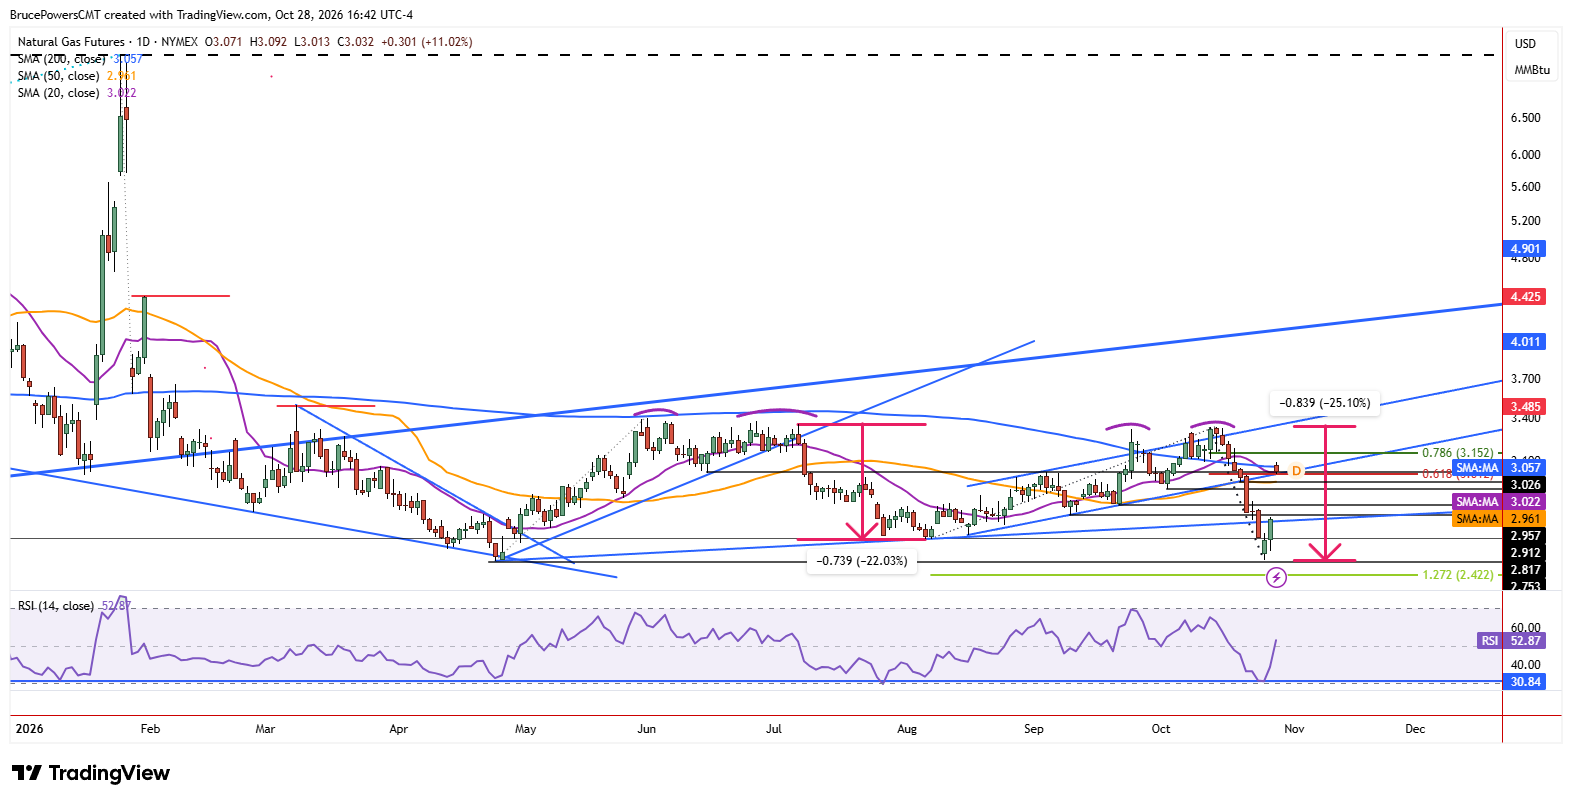
A decisive breakout above Wednesday’s high of $3.09 would extend the short-term advance. However, the recent highs have established a lower swing high, while two recent failures to reclaim the 200-day moving average reinforce the significance of long-term resistance. These factors suggest that resistance near the double top’s upper boundary could eventually prevail, triggering another turn lower.
Breakout or Breakdown Ahead
For now, natural gas can continue to trade within a wide range while remaining inside a large, developing rectangle consolidation pattern that includes two recent swing highs and two swing lows. A break below $2.96 would put the lower swing lows into focus, while a move above $3.09 would signal renewed short-term strength and open the way toward $3.15. In the coming sessions, ore information should emerge to help clarify market sentiment and determine whether resistance or support gives way first. Until them, the consolidation range leaves both outcomes possible.
If you’d like to know more about how to trade natural gas, please visit our educational area.