


Buyers Challenge Moving-Average Resistance
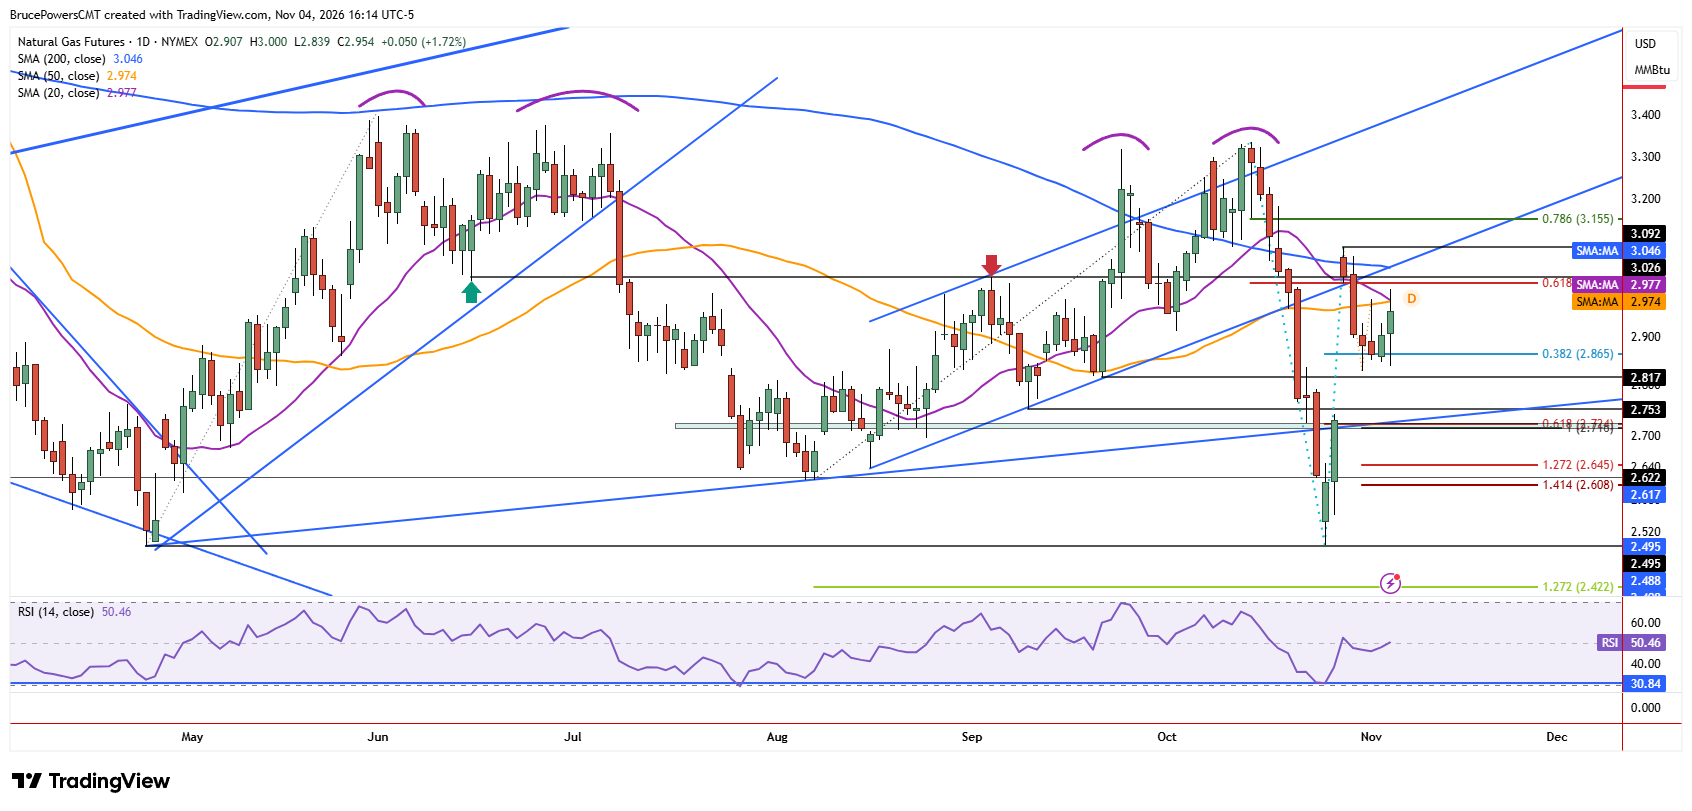
Natural gas strengthened on Wednesday to a four-day high of $3.00, testing resistance near key moving averages. An advance above Monday’s high of $2.98 provided a bullish signal, but a daily close above that level is needed for confirmation. At the time of writing, natural gas has pulled back below the alignment of the 20-day and 50-day moving averages near $2.98, which is also Monday’s high.
Therefore, a daily close below $2.98 would suggest that sellers are defending that resistance area. Conversely, a daily close above $2.98 would confirm the strength indicated by Wednesday’s advance and increase the potential for tests of higher resistance levels. The ability to reclaim this initial resistance area is therefore important to determining whether the lates advance can develop into a more sustained recovery.
Failed Breakdown Exposes Seller Weakness
Key support is at the recent higher swing low of $2.83, especially after it was tested again during Wednesday’s session. An initial decline to a low of $2.84 broke support at the lows of the previous two sessions, near $2.85. That was a bearish signal that failed, since buyers were quickly attracted to the lower price area, and the recovery was followed by a rally above Tuesday’s high. The failed breakdown suggests that sellers were unable to maintain downside momentum, despite initially pushing prices below short-term support.
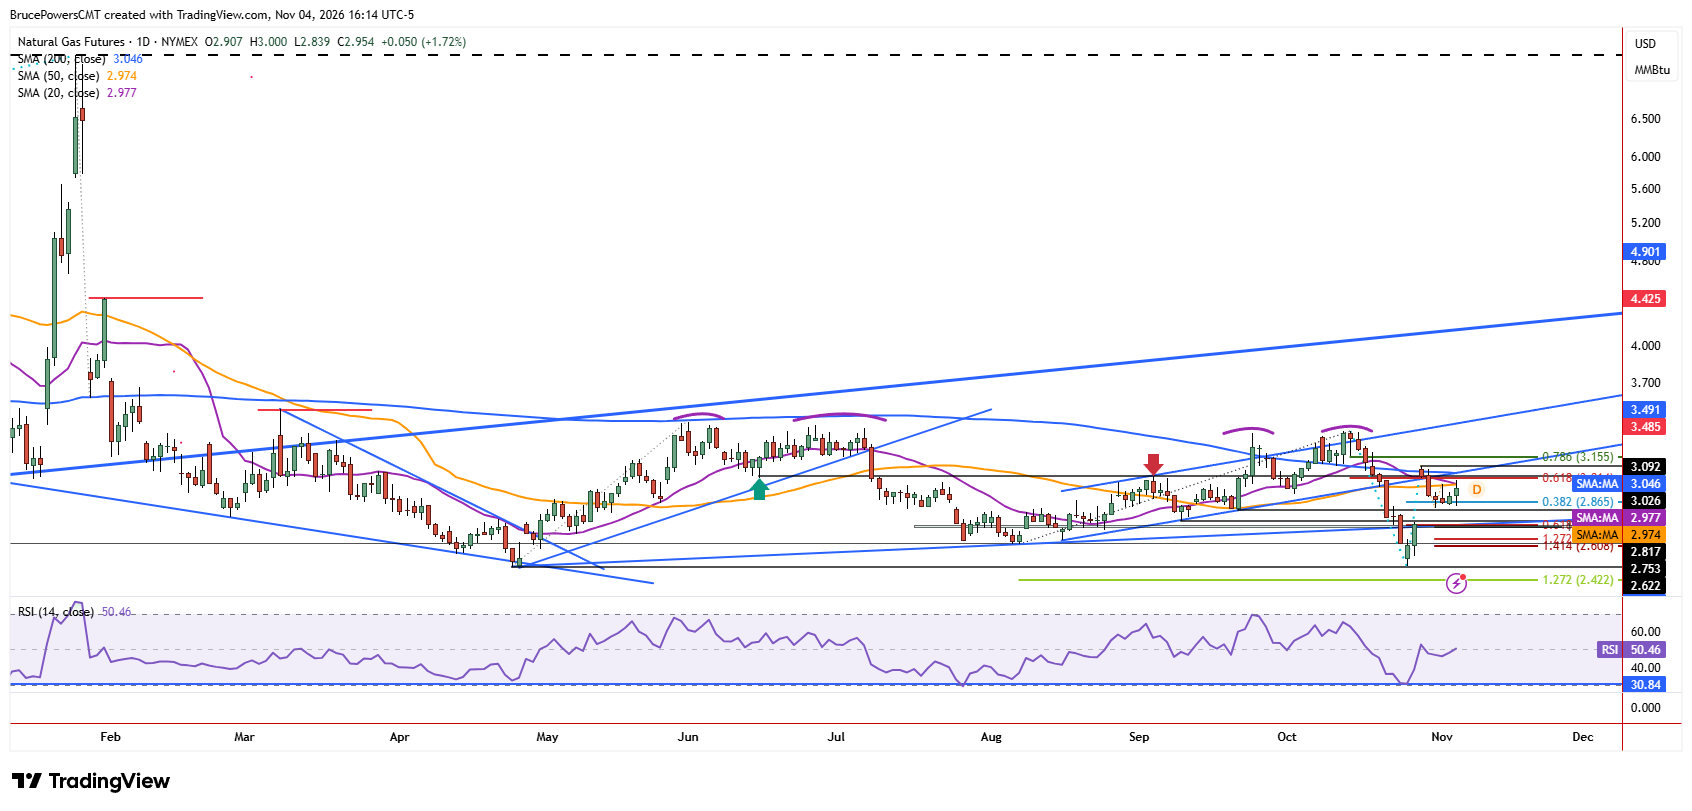
Taken together, natural gas is showing strength with the potential to move higher, but also the possibility that resistance may persist. Since support near the higher swing low was retested on Wednesday and followed by a rally to a four-day high, the next important decision point appears to be whether buyers can overcome resistance near $2.98.
Failed breakouts have the potential to move sharply in the opposite direction. Adding to the bullish signs is the formation of a bullish outside day on Wednesday. A breakdown below the prior day’s low triggered a bearish signal, but that signal failed following a rally above Tuesday’s high of $2.93. This reversal of initial bearish price action reinforces the support zone near the recent higher swing low.
Higher Resistance Defines Next Upside Test
This price action provides further evidence that support for the pullback has been reached and natural gas is again attracting buyers. Nonetheless, another resistance zone ranges from the 61.8% Fibonacci retracement at $3.01 to the 200-day moving average, currently near $3.05. Since resistance was confirmed near that average during the prior advance, it is anticipated to again mark a resistance zone.
Natural Gas Price Forecast
Every new Natural Gas analysis as it publishes, today's technical signal and key levels, live price — on one page.
See all Natural Gas forecastsThe recent $3.09 high adds to its significance, since it reinforces resistance and a rally above that level would begin to improve the bullish outlook. Consequently, a sustained reclaim of $2.98 would be the first step toward testing this higher resistance zone, while a failure would leave sellers defending the current moving-average barrier.
If you’d like to know more about how to trade natural gas, please visit our educational area.