


Bullish Reversal Falters at Moving-Average Resistance
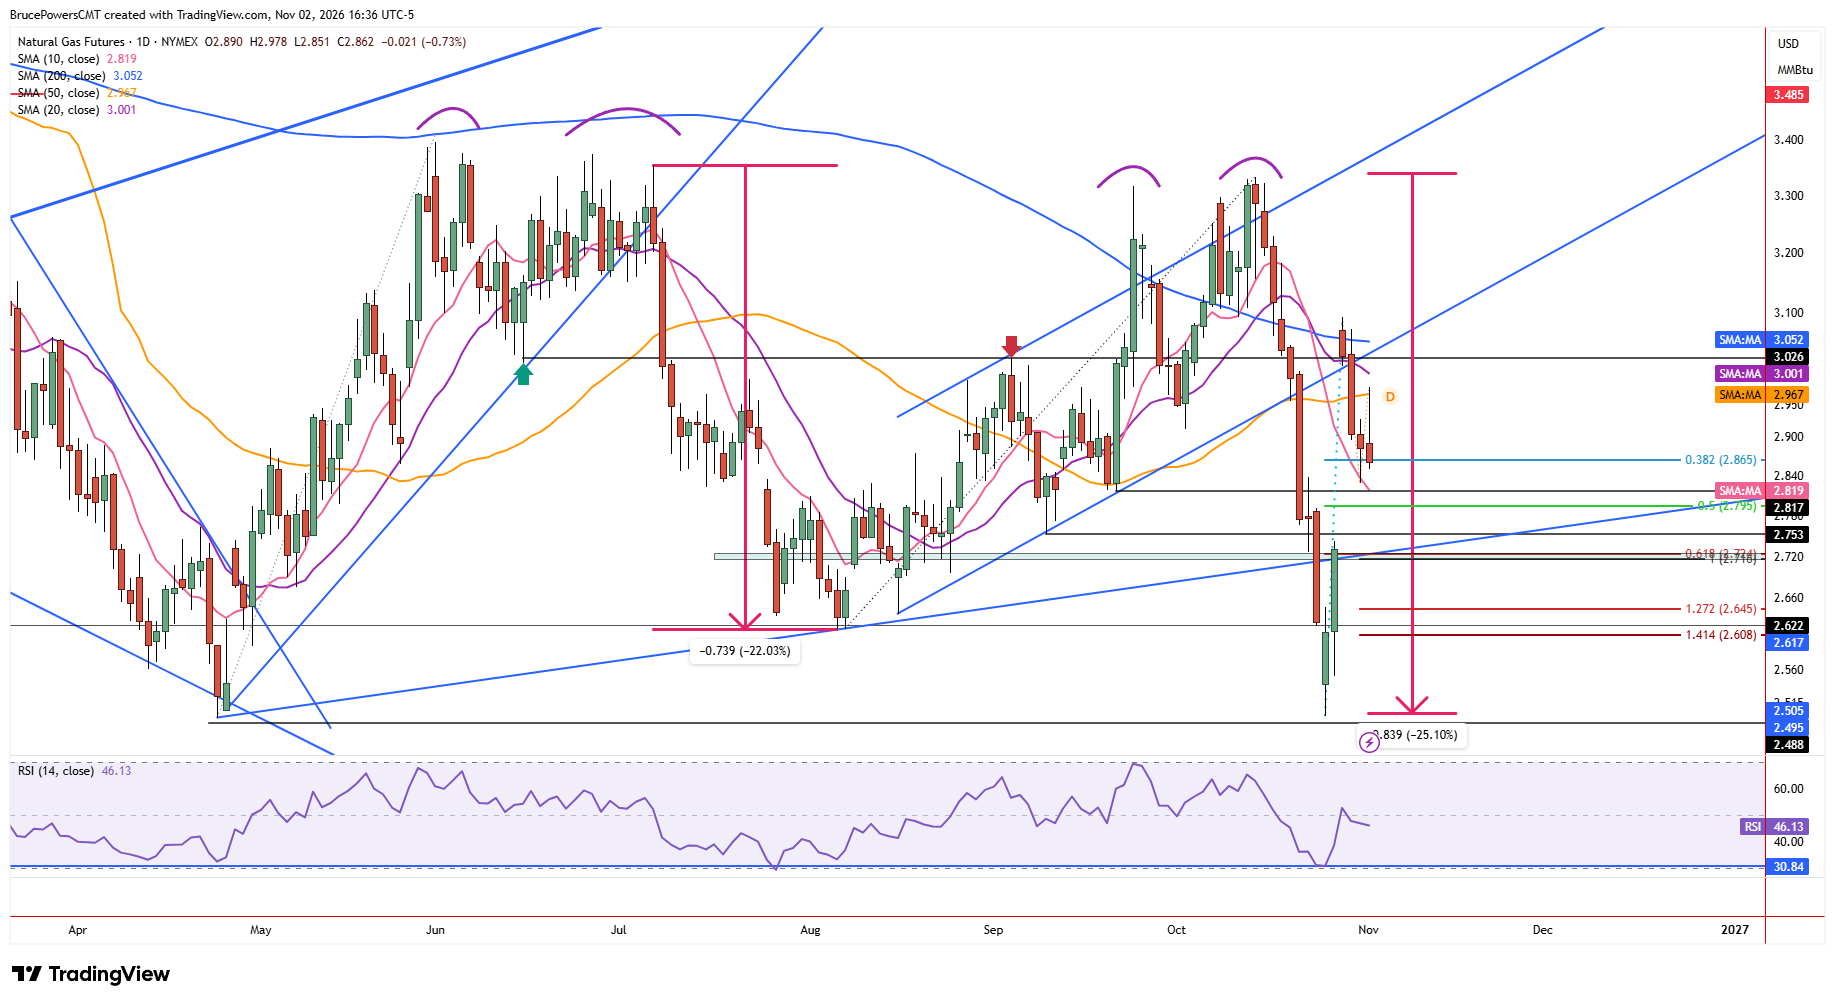
Natural gas triggered a one-day bullish reversal signal on Monday with a rally above Friday’s lower daily high of $2.93. However, sellers took back control once a high of $2.98 was reached, with resistance emerging at the 50-day moving average, currently near $2.97. A higher daily low was established at $2.85 at the time of writing, but sellers continue to control the price action, with trading in the lower third of the day’s range. This puts natural gas on track to complete a bearish rejection candle with a long upper wick, potentially negating Monday’s bullish reversal signal.
Bearish Continuation Puts Nearby Support at Risk
The bearish candlestick pattern would reflect a failed bullish reversal attempt, with sellers regaining control ahead of the close. This suggests they could remain in control heading into Tuesday’s session. Therefore, a bearish continuation signal would trigger below the day’s low, putting Friday’s low at $2.83 at risk of being tested as support and possibly broken to the downside. Additional short-term dynamic support is also represented by the falling 10-day moving average near $2.82, while a higher swing low at $2.82 from September and the 50% retracement of the prior advance at $2.80 define the next lower potential support zone.
$2.72 Confluence Could Become a Critical Test
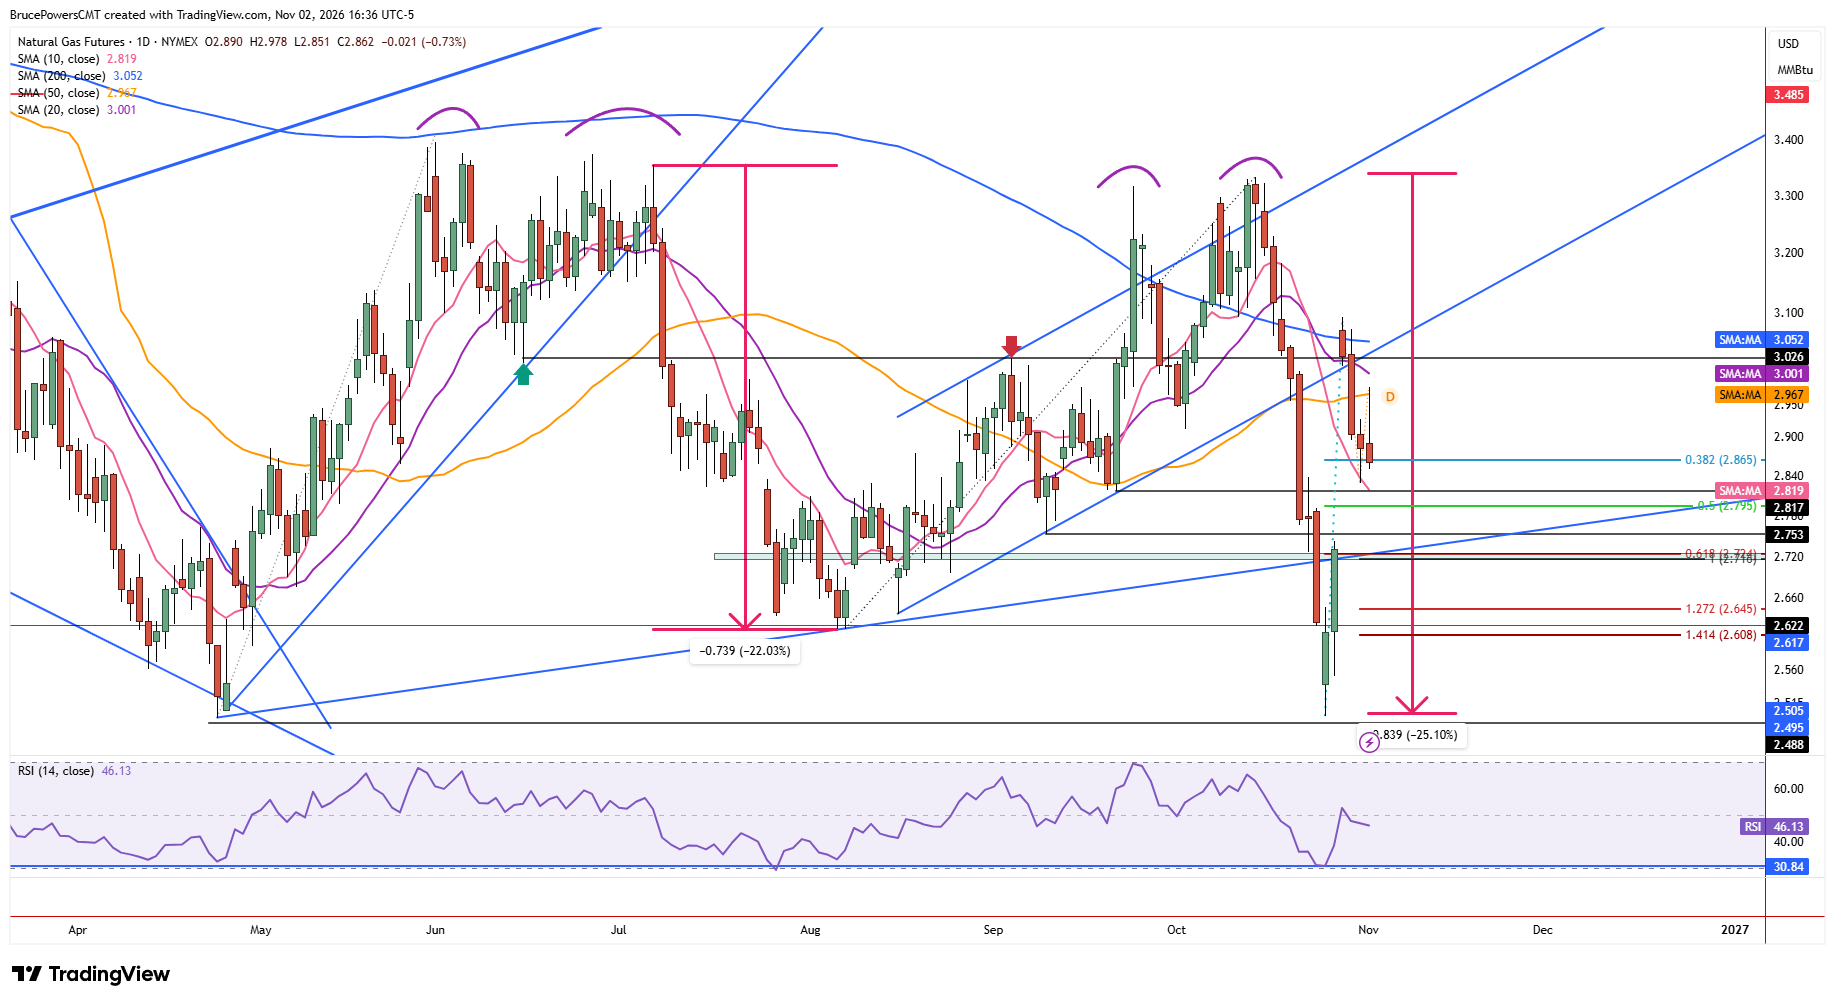
Notably, that lower potential support range near $2.72 is aligned with the rising trendline originating from the August swing low. That trendline previously failed as support during the prior decline, as confirmed by a break below the line followed by two daily closes beneath it. This suggests that another drop below the line would reinforce the bearish outlook, with a daily close below the trendline providing confirmation. Consequently, the ability of natural gas to hold the nearby support levels will be important in determining whether Monday’s bullish reversal attempt has any lasting significance.
If you’d like to know more about how to trade natural gas, please visit our educational area.