


Resistance Tested Again Near $3.42
Natural gas once again challenged key long-term resistance on Thursday near $3.40-$3.42, only to see sellers reassert control. During the session, natural gas hit a high of $3.42 before sellers regained control and pushed prices lower. Sellers remain in control at the time of writing, with trading continuing near the lows of the day, currently at $3.24. So far, this suggests a minor pullback before another upside breakout attempt.
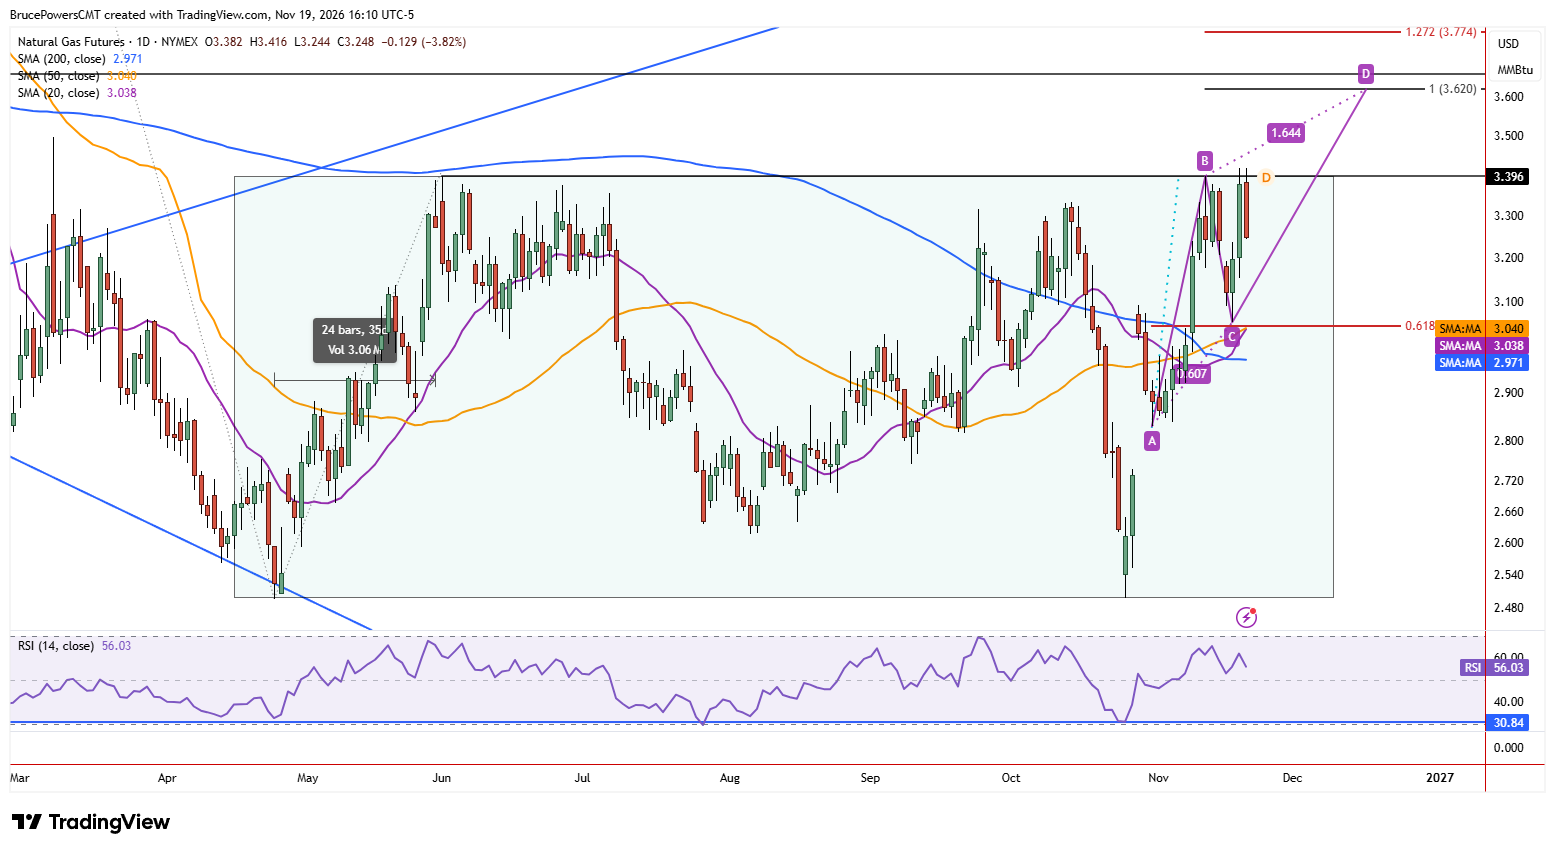
Moving Averages Align as Demand Accelerates
Strength was recently indicated by a reclaim of the 200-day moving average, followed by a pullback that tested it as support, resulting in a higher swing low at $3.05 on Tuesday. Also, both the 20-day and 50-day moving averages recently crossed above the 200-day moving average, currently near $2.97. In addition, the current advance that followed the $2.50 low in October reached a high of $3.40 last week in only 12 days, while the prior two advances took twice as long or longer to reach a high. This shows an increase in underlying demand, which will be needed for a decisive breakout above $3.42.
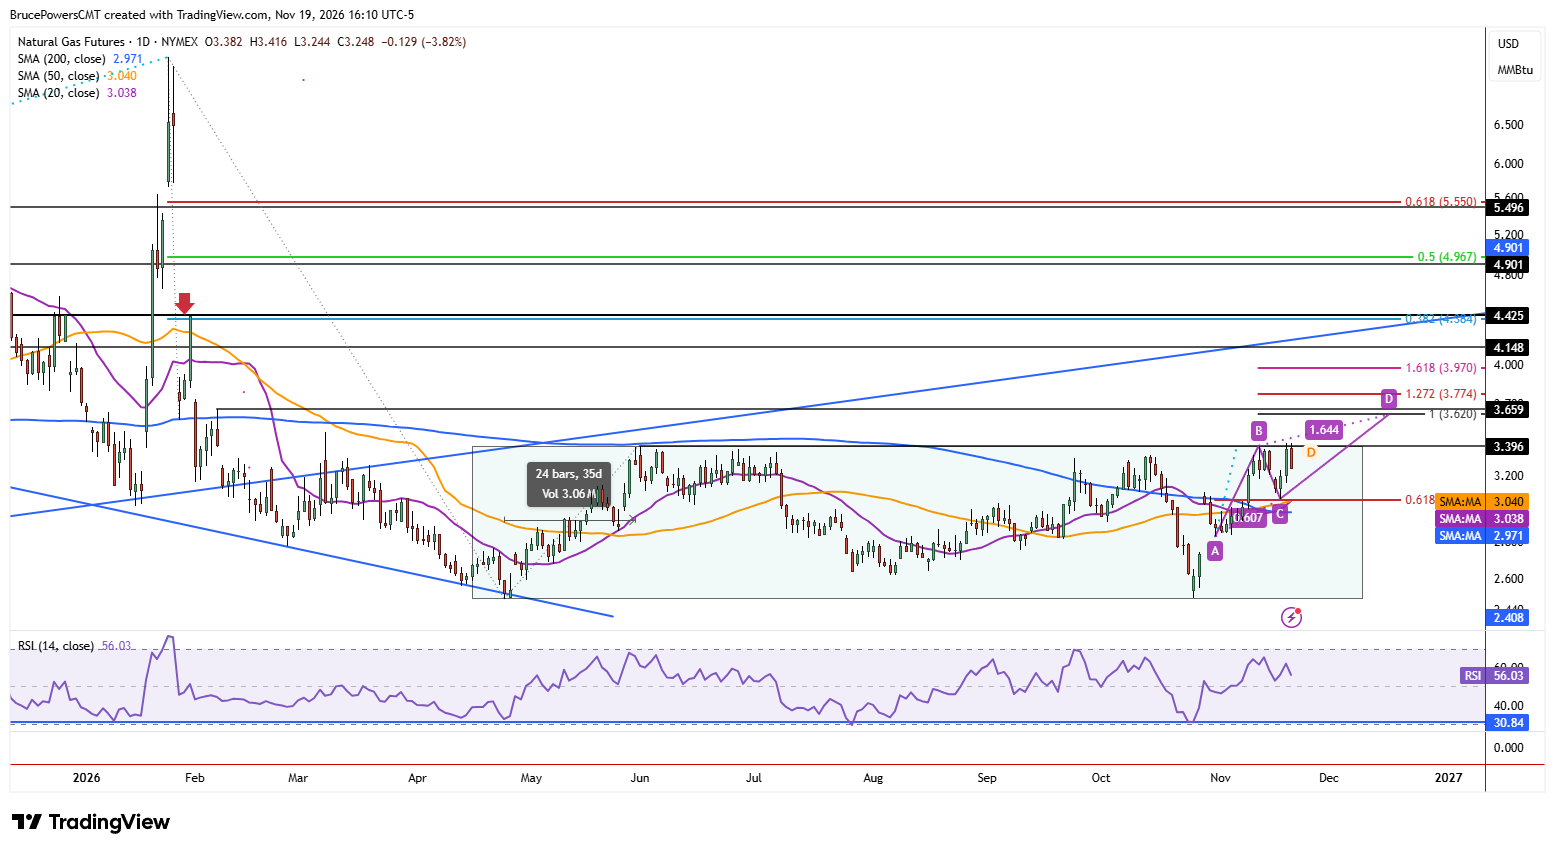
Rectangle Pattern Sets Stage for Targets
Last week’s high of $3.40 matched the earlier high of $3.40 from June and defines the top boundary of a large rectangle consolidation pattern that is poised for a breakout. That level could still be used as a signal, but the $3.42 level was also reached this week and should be considered as well. The bullish scenario will depend on support holding above the $3.05 level. Potential upside targets following a decisive breakout include previous swings, beginning with $3.66.
There is also a rising ABCD pattern that suggests an initial upside target near $3.63, which is not far from $3.66, providing a potential resistance zone from $3.63 to $3.66. Once the current advance matches the prior advance, resistance is likely to reappear near the same $3.40-$3.42 zone that was tested again on Thursday, underscoring that a clean breakout above this long-term barrier remains the key requirement for further upside.
If you’d like to know more about how to trade natural gas, please visit our educational area.