


Rally Stalls as Channel Support Holds
Natural gas turned lower during Monday’s session, from a resistance zone that had stopped the prior advance after a 20% gain to a high of $3.40. Support was found at the session’s low of $3.09, which is at the lower boundary of a rising channel.
This was the first test of that boundary as support since it was recovered last week on the way to the $3.40 high and a test of resistance near the top of the channel. The support zone was reinforced by the 50% retracement of the prior advance at $3.11 and the swing high of $3.09. At the time of writing, natural gas has recovered the support levels and is on track to close the session above the top of the range $3.11.
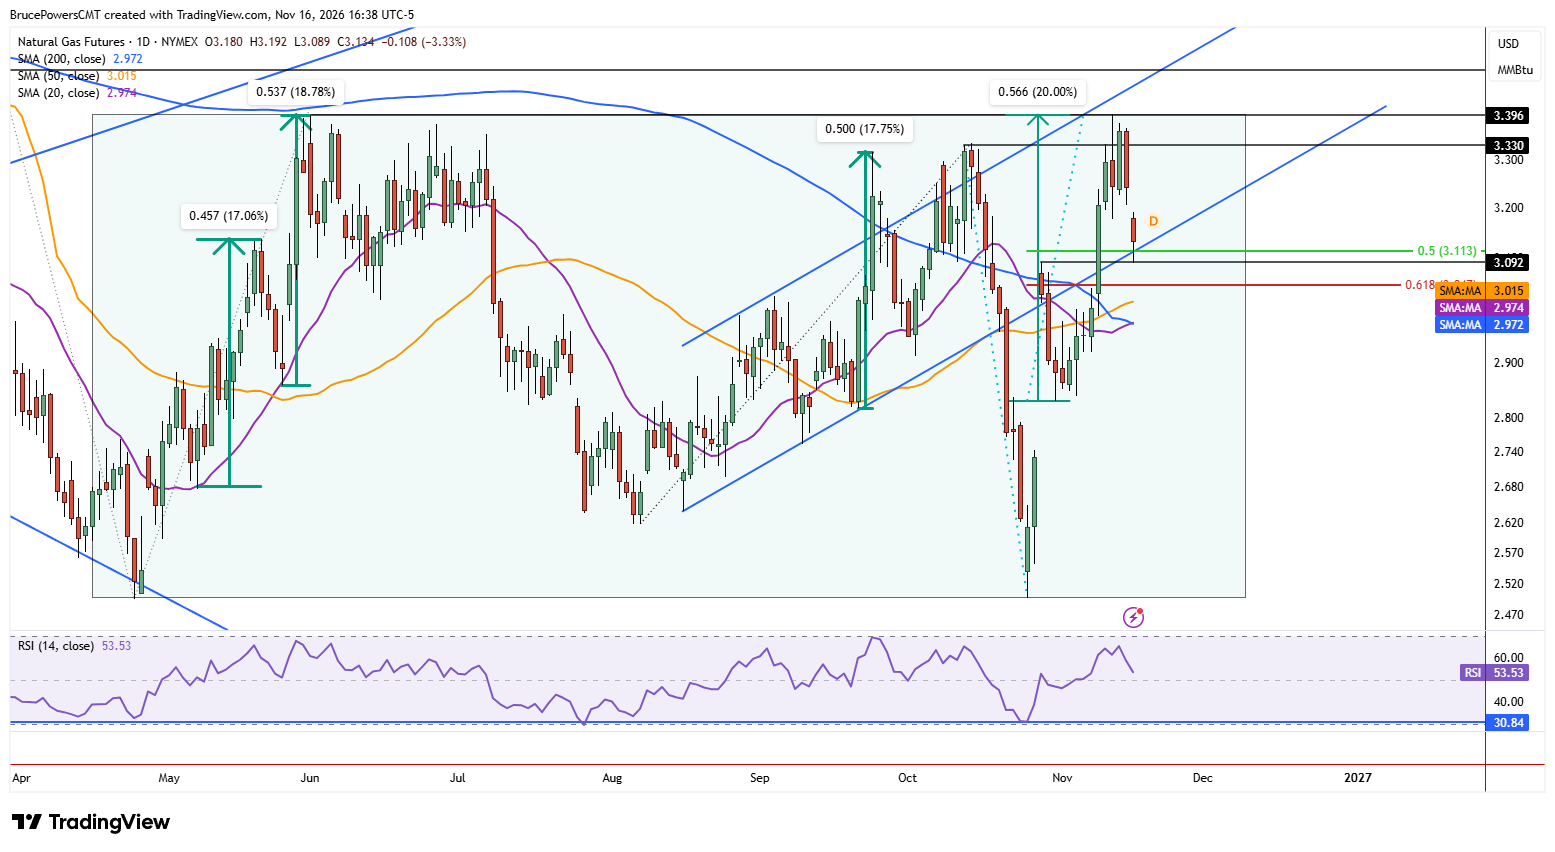
Critical Support Confluence in Focus
The confluence of support indicators establishes Monday’s low as a key near-term level, since a drop below it would signal another breakdown from the rising channel. However, the channel has already failed to retain its initial structure following a sharp breakdown in October. Of course, this is why multiple indicators pointing to a similar price level are preferred, especially when the situation gets complex, which is the current case for natural gas.
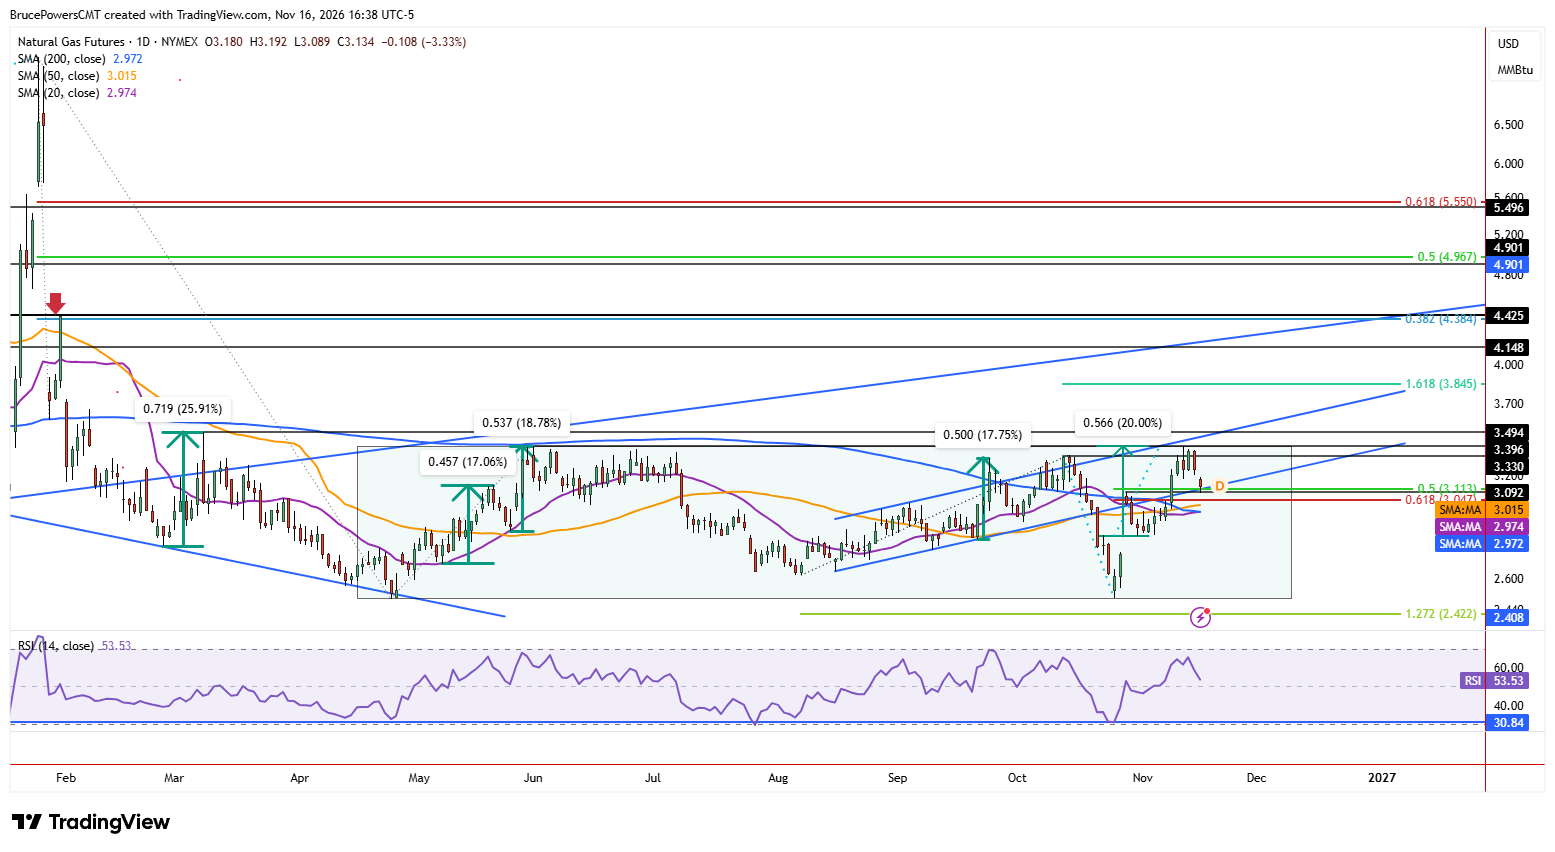
In the bigger picture, natural gas has been consolidating since February of this year. After a new swing low of $2.50 was established in October, a large rectangle formation appeared. When the market again recognizes a key level, it continues to reinforce the pattern. So, a drop below Monday’s low would trigger a break below the channel, potentially bringing price quickly to support represented by the 200-day moving average at $2.97 primarily and reinforced by the nearby 50-day moving average at $3.02 and the 20-day moving average at $2.97.
$3.40 Breakout Opens Higher Targets
On the upside, resistance is near last week’s high of $3.40. However, a decisive breakout above that level would confirm the rectangle formation and therefore the potential for a spark in bullish momentum. An initial target would then be the prior swing high of $3.49, followed by a 161.8% Fibonacci extension of the recent decline at $3.85.
If you’d like to know more about how to trade natural gas, please visit our educational area.