


The latest information for the U.S. natural gas market comes from Sunday’s weather update, NOAA’s Climate Prediction Center outlook issued on Sunday at 3 p.m. Eastern. It favors above-normal temperatures across the eastern half of the country for November 21 through 25. It assigns a greater than 60% probability to above-normal temperatures across much of the northeastern quadrant of the country.
The implication is a potential restraint on heating demand during that window of time. A warm anomaly in a populous heating region can matter more than one in an area with relatively little winter gas use. But the map does not provide a national gas demand volume, so it cannot justify an actual estimate of lost consumption or the next storage withdrawal directly.
Storage Release Numbers
The latest storage series supplies a bit of a measured backdrop for natural gas markets. The EIA’s November 13 release put Lower 48 working gas at 3,862 billion cubic feet for November 6, up from 3,801 billion cubic feet a week earlier. South Central inventories increased from 1,208 to 1,235 billion cubic feet. The chart follows every weekly national reading from October 2 through November 6.
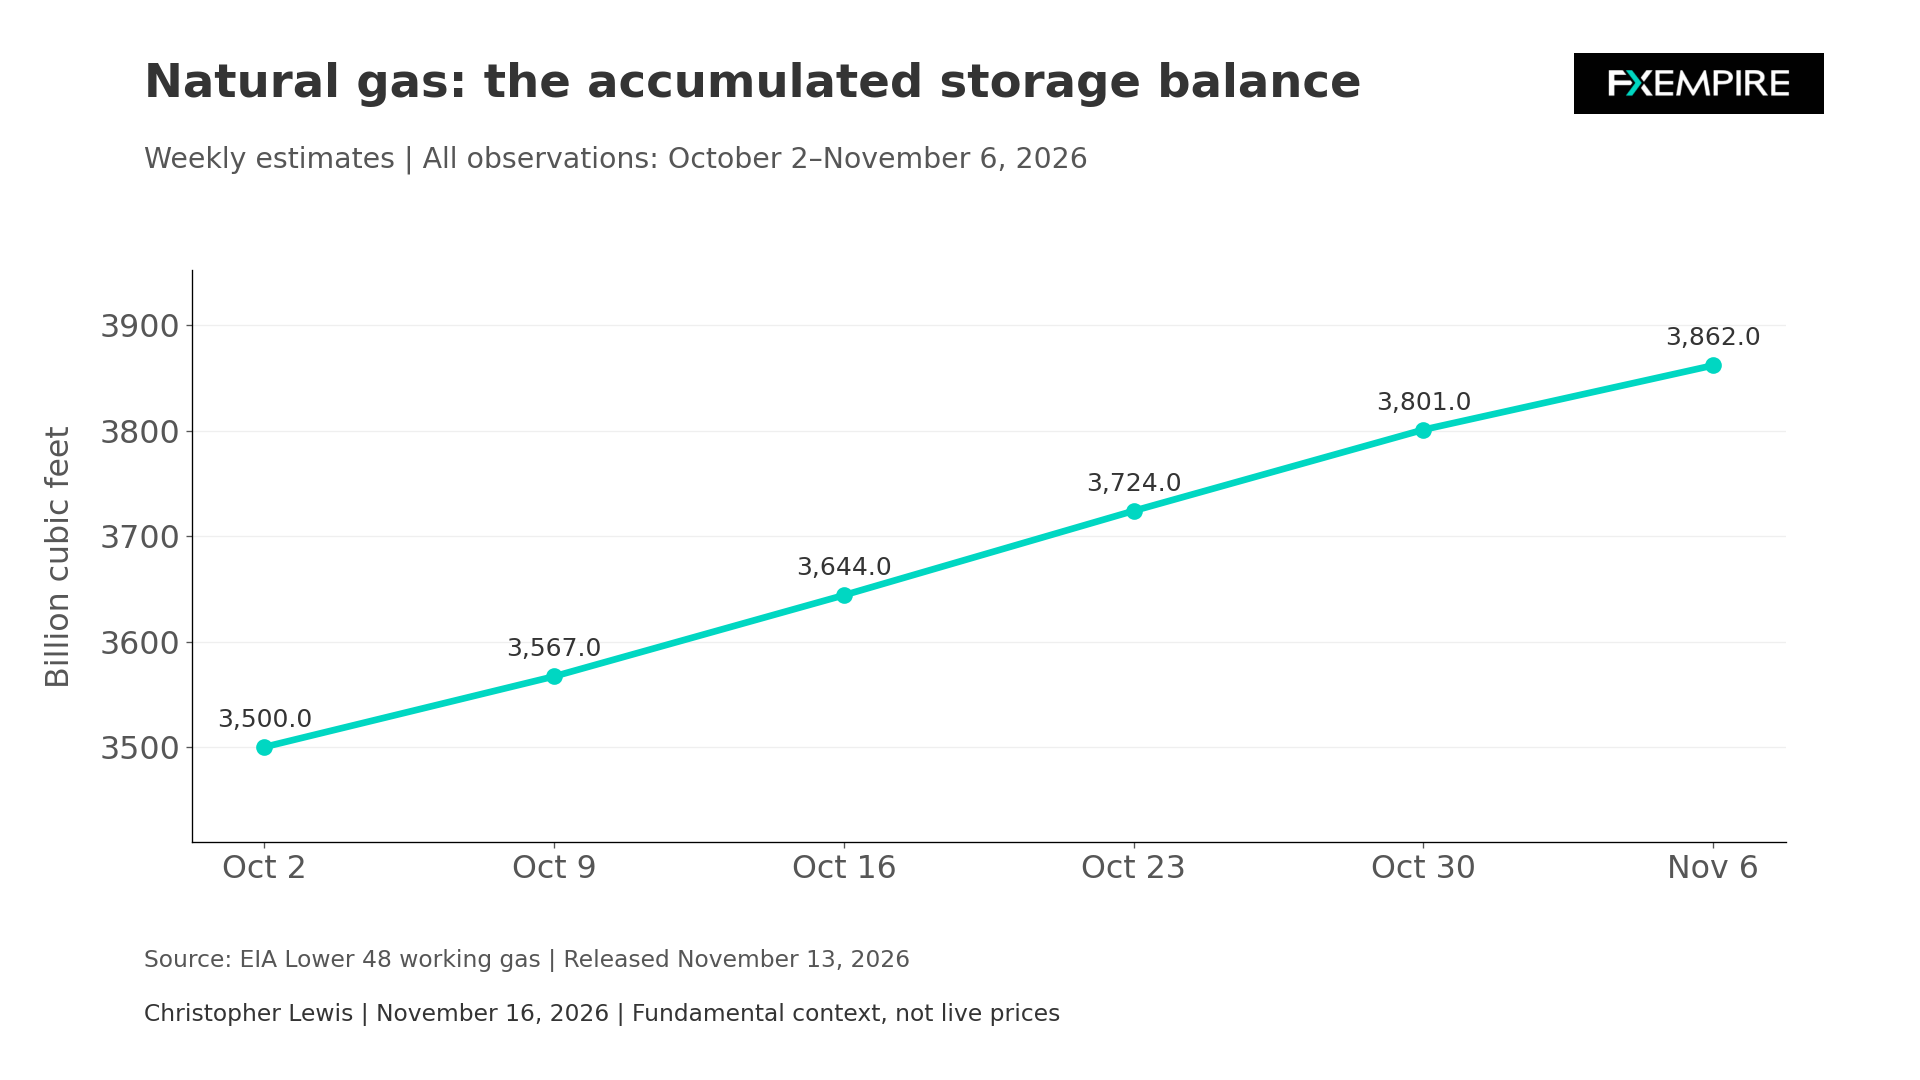
The national comparison remains more comfortable than last year’s comparison alone would suggest. Stocks were 75 billion cubic feet above the five-year average, but 92 billion cubic feet below the year-earlier level. South Central was still slightly below its own seasonal average. That gives more or less a regional picture than anything else.
On November 19, we’ll get the next storage report. Storage will explain the accumulated balance from both national and regional areas. Weather forecasts will also be watched very closely to give us some influence on expectations for what comes after.
Liquefied natural gas remains another demand channel, although export capacity limits how quickly overseas conditions can translate into additional U.S. gas use. EIA’s November 10 outlook describes terminals running near full capacity and forecasts exports reaching 19 billion cubic feet per day next year. The agency’s model inputs were finalized November 5.
Natural Gas Price Forecast
Every new Natural Gas analysis as it publishes, today's technical signal and key levels, live price — on one page.
See all Natural Gas forecastsCheniere Reports Increase in Capacity
This is an example of a completed export report behind the longer-term LNG story. In its October 29 results, Cheniere said that the seventh and final mid-scale train at Corpus Christi Stage 3 reached substantial completion in August. The company described the project as increasing its LNG production capacity by more than 20%.
The same release highlights why future commercial agreements need a little bit of different treatment. Cheniere disclosed contracts with QatarEnergy for up to 4 million tons per year beginning in the early 2030s, with part dependent on a final investment decision. They do support a longer-term investment horizon, although they will not have an influence on immediate price action.
Completed capacity and utilization answer separate questions. An export plant may be available to run below its potential because of maintenance, feed gas availability, or cargo scheduling. Conversely, a facility already running near capacity, as we have now, cannot instantly consume sustainably more gas merely because of a price rise overseas.
Power Demand
Power demand can add another distinction. EIA forecasts electricity generation growth of 1.2% next year, with most of the increase coming from utility-scale solar. A larger electricity market, therefore, does not translate one-for-one into additional gas burn. The generating mix and dispatch economics all influence the gas share.
The question now will be whether eastern warm temperatures persist in subsequent forecasts. If they do, the market has less reason to price in immediate heating-driven tightening. An important colder revision could change that assessment, but it needs evidence from a new forecast cycle.
Price Action Looking for Buyers
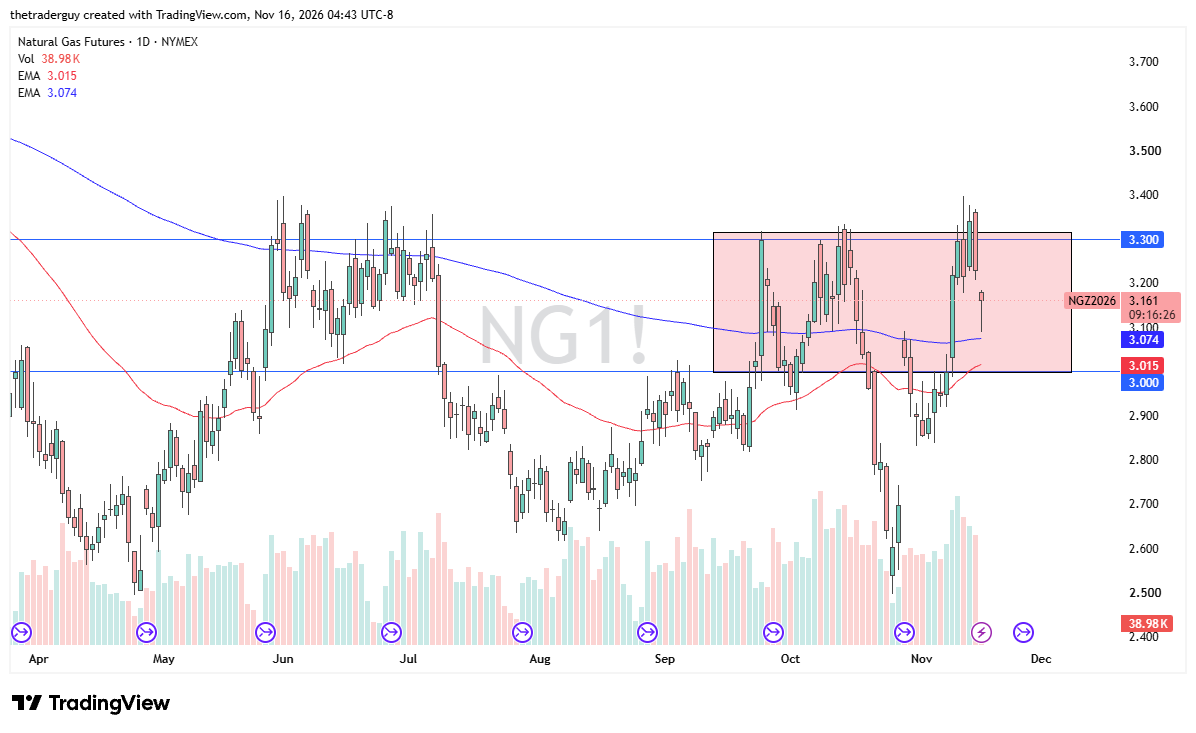
From a price analysis standpoint, the natural gas market did gap to the downside to kick off the session, reached toward the 200-day EMA, which is near $3.08, and bounced. At this point, it still looks very much like a buy-on-the-dip market, but there is a significant barrier just above the $3.30 level. It’s a bullish time of year; we just don’t have the weather reports to get this thing moving quickly.
If you’d like to know more about how to trade natural gas, please visit our educational area.