


On Wednesday, Henry Hub natural gas is dealing with official weather guidance leaning against any type of early broad heating-demand surge, which can be found this time of year, while the latest storage data shows that national and regional cushions are not equally comfortable.
NOAA’s October 27 outlook favors above-normal temperatures across the East for November 2 through 6, with probabilities exceeding 60% from the Southeast and Mid-Atlantic northwestward to the Great Lakes. The assessment is that the forecast could reduce heating requirements relative to a colder outcome in important consuming areas. It does not measure actual consumption, and a probability of warmth is not necessarily the percentage that gas demand will change. The size, timing, and location of temperature movement will determine the eventual effect on the markets.
The longer forecast window remains a bit warmer than anticipated. NOAA favors above-normal temperatures throughout the contiguous United States for November 4 through 10, although confidence will vary by region. The discussion rates forecast confidence as average in general. These overlapping outlooks are not independent confirmations of the same result. They are conditional guidance and should be thought of simply as a weather forecast.
Storage Remains a Balance Indicator
The EIA’s October 22 release estimated that working gas in the Lower 48 measured 3,644 billion cubic feet as of October 16, after a 77 billion cubic feet weekly injection. That was 35 billion cubic feet above the 5-year average and 152 billion cubic feet below the year-earlier comparison.
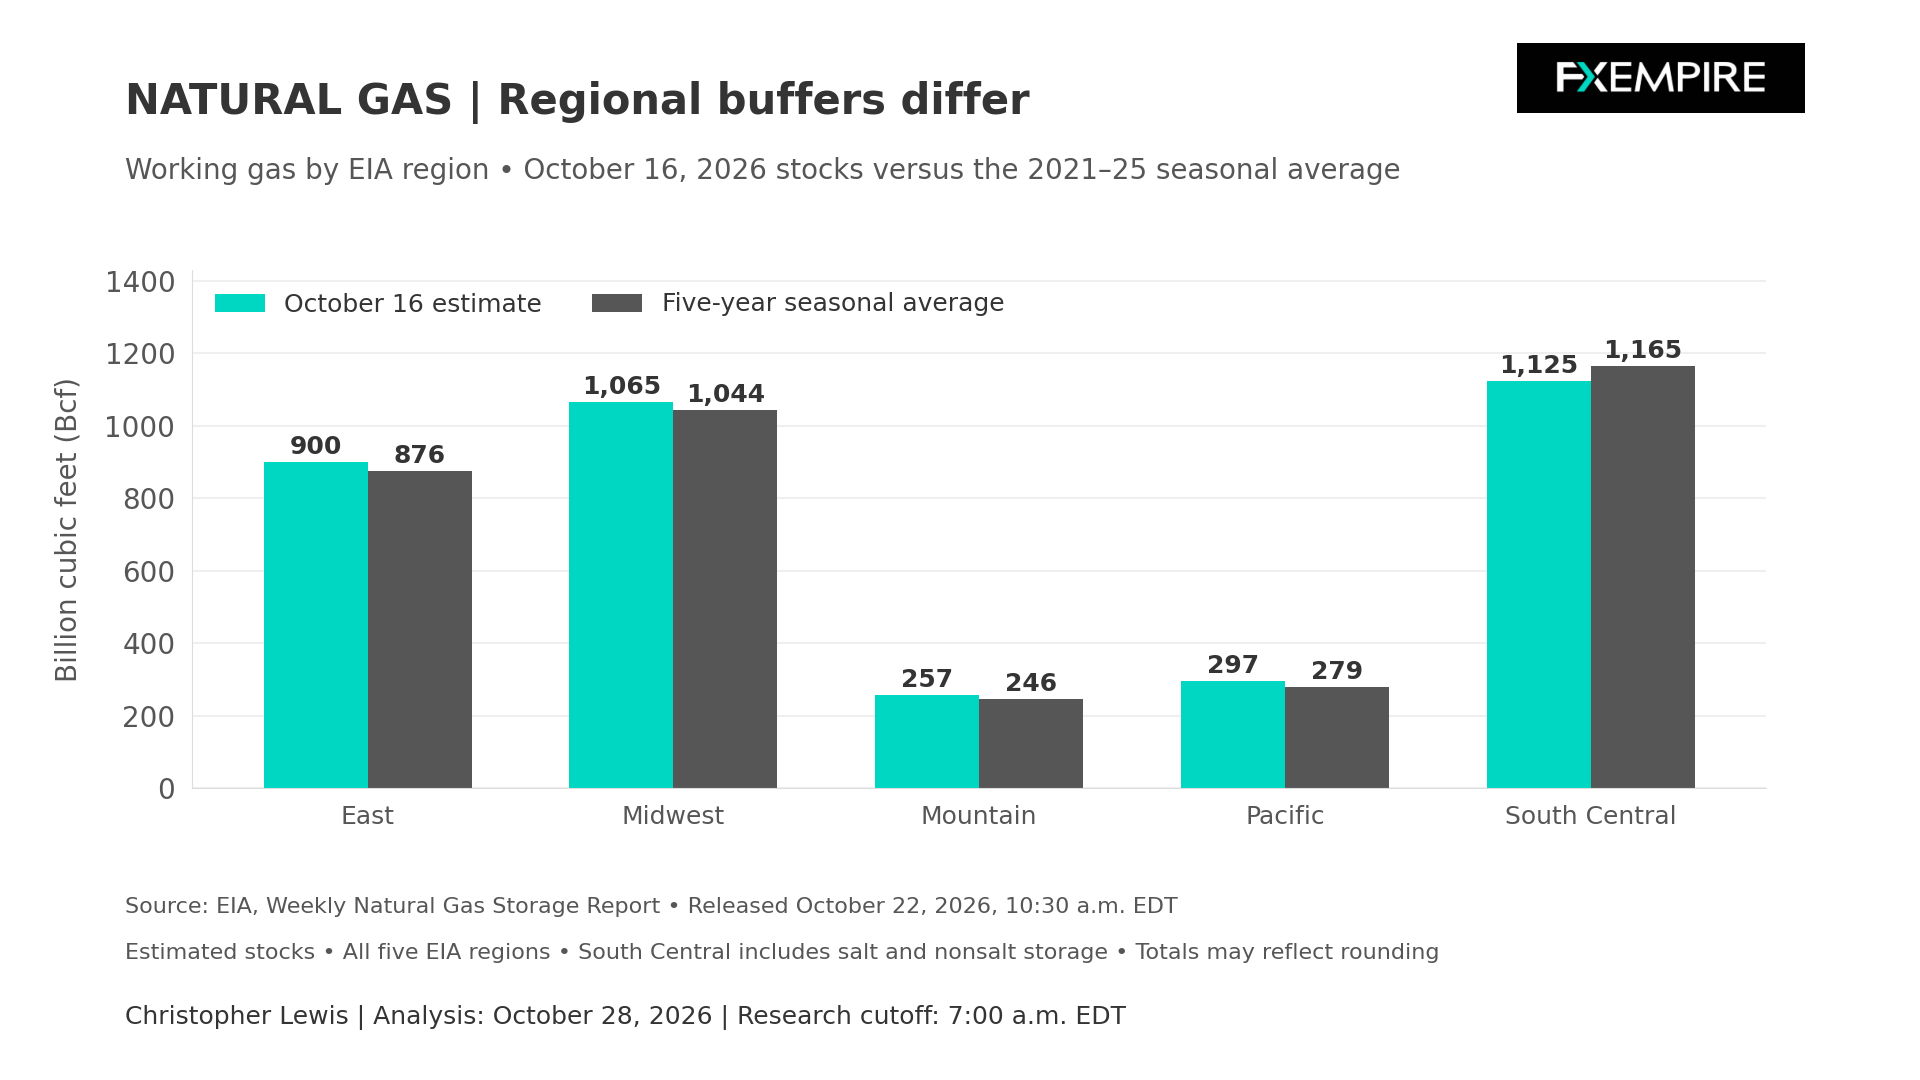
The regional chart explains why national surplus should not be overinterpreted. South Central stocks were 1,125 billion cubic feet against the 5-year average of 1,165 billion cubic feet. By contrast, the East held 900 billion cubic feet against 876 billion cubic feet, and the Midwest held 1,065 billion cubic feet against 1,044 billion cubic feet.
Deficit in the Gulf?
A modest national excess can therefore coexist with a deficit closer to Gulf region supply and export activity. The interpretation is that location matters because stored gas must be deliverable through available infrastructure when demand rises. Aggregate volume alone does not describe pipeline capacity, withdrawal flexibility, or distribution to customers. The chart compares all 5 EIA regions on the same units and scale. It does not imply an immediate pipeline bottleneck anywhere.
The next storage report is Thursday at 10:30 a.m. The market will be watching to see whether the national cushion expands and whether South Central rebuilding keeps pace, rather than treating the expected direction of the seasonal injection as an observed outcome.
Natural Gas Price Forecast
Every new Natural Gas analysis as it publishes, today's technical signal and key levels, live price — on one page.
See all Natural Gas forecastsOctober Production Forecasts
EIA’s October outlook provides broader context, projecting dry production averaging 112.20 billion cubic feet per day in 2026 and 116.13 billion cubic feet per day in 2027. Its LNG export forecasts are 17.6 and 18.6 billion cubic feet per day, respectively. This is not an average of current daily supply, but rather a forecast by experts.
The forecast illustrates the potential offset between additional production and additional exports. More export demand can tighten the domestic balance if supply growth fails to keep pace. Conversely, output growth combined with mild domestic weather can leave more gas available for storage. These are conditional balance mechanisms, not verified changes in flows in the morning.
Storage Forecasts
Timing also has a big part to play here. EIA completed the forecast on October 1 and published it on the 6th. It does not incorporate subsequent market events. Its projection of 3,850 billion cubic feet in storage at the end of October is therefore a forecast, nothing more.
International demand reaches Henry Hub through actual export capacity and gas purchases. A high overseas price alone cannot establish additional U.S. outflows if terminals or connecting infrastructure limit deliveries. This is why measured export activity would be more useful than assuming a global price signal automatically tightens domestic supply, despite the fact that gas prices have tripled in Europe.
Power demand deserves attention as well. In my assessment, mild autumn weather can reduce heating needs without delivering the strong cooling load associated with summer heat. Generation, regional patterns, and competing fuels can modify the effect.
For Wednesday, the balance favors caution about assuming we will see immediate weather-driven tightening. Colder revisions, disappointing storage rebuilding, or a verified supply interruption would strengthen that argument.
Technical Setup
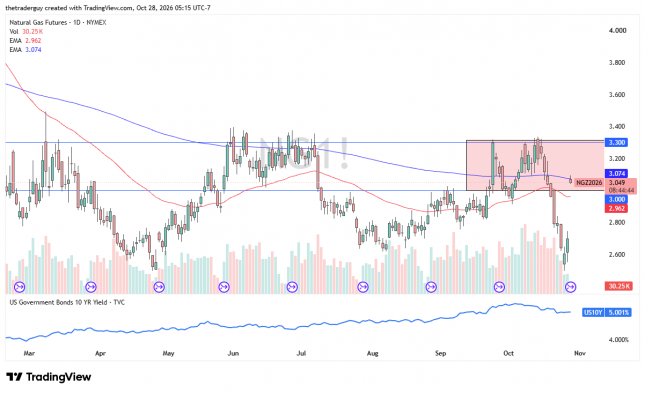
The technical analysis for natural gas is a bit skewed today as the market has switched over to the December contract, jumping all the way to $3.06. This makes a certain amount of sense, though, because historically speaking, demand will pick up in the month of December. Even though NOAA’s forecast suggests warmer days ahead, it only goes out to mid-November. Therefore, short-term pullbacks should continue to offer buying opportunities as the season changes.
If you’d like to know more about how to trade natural gas, please visit our educational area.