


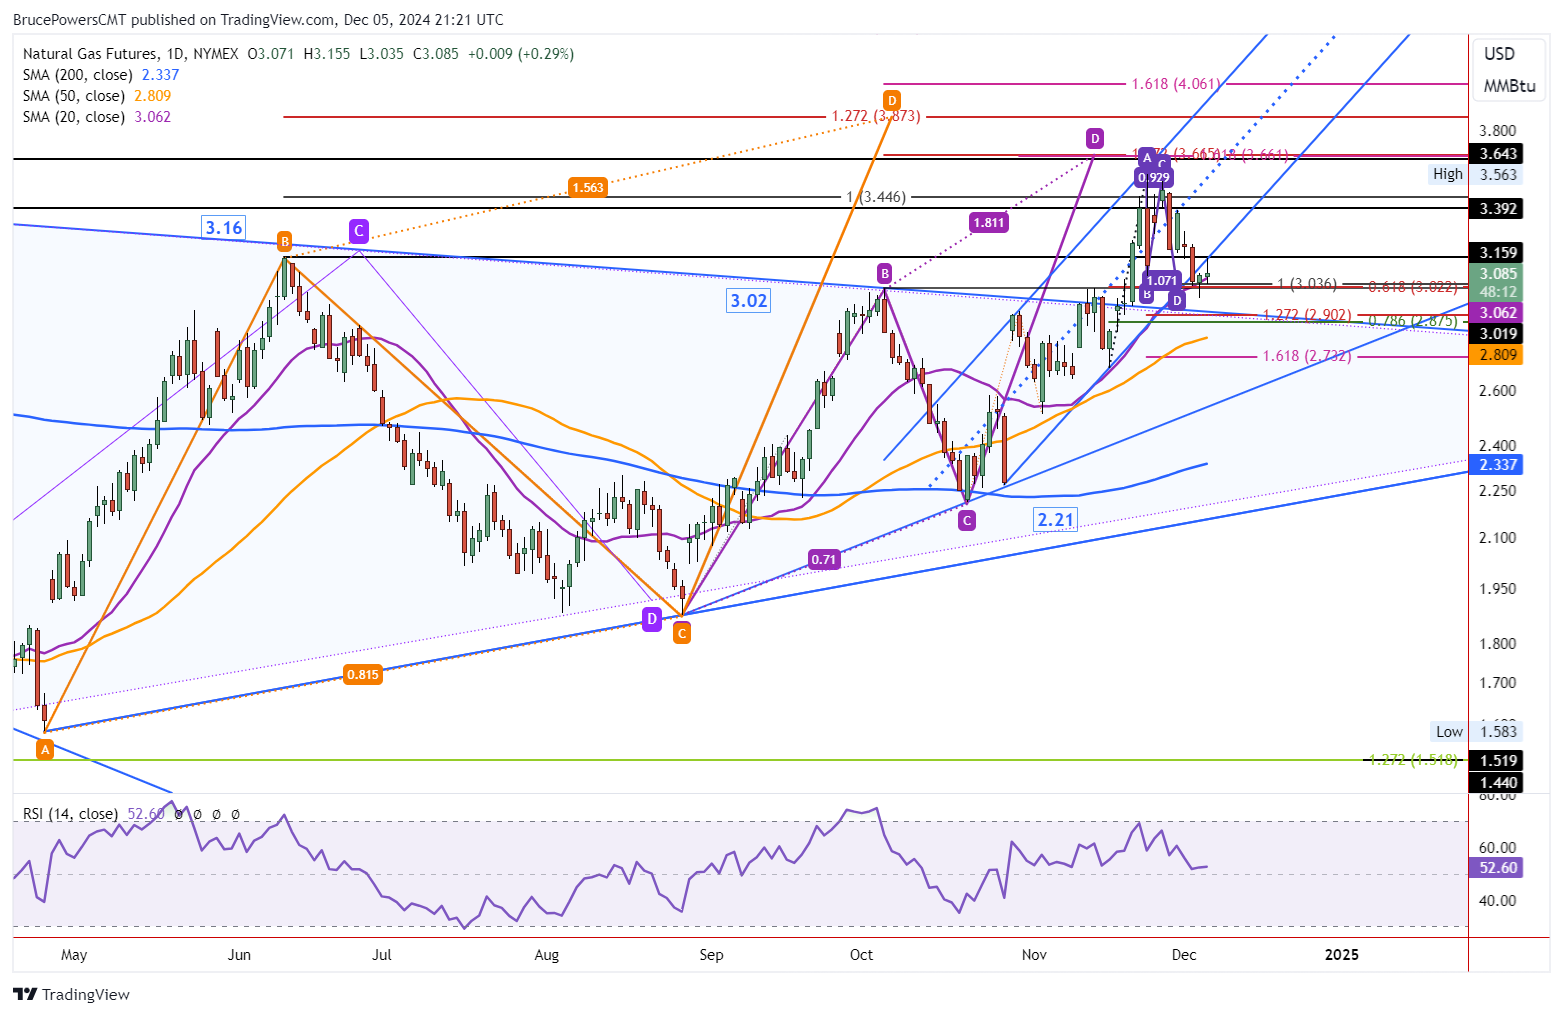
Natural gas triggered a one-day bullish reversal on Thursday as it rose above Wednesday’s high to reach a high of 3.115 for the day. Wednesday completed a bullish hammer candlestick pattern. It has some potential value given that support was seen around the 61.8% Fibonacci retracement, the completion of a falling ABCD pattern at 3.04, and a rising 20-Day MA. In other words, this would be a logical area for a bullish reversal that may be sustainable. Nonetheless, it is not off to a good start.

Poised to Close Weak
Natural gas is poised to close weak for the day, below the halfway point for the day’s trading range. And that is after a successful test of resistance at the bottom of the internal uptrend line. Along with the 20-Day MA line, the trendline identified dynamic support for the uptrend. The trendline needs to be reclaimed before natural gas has a chance to proceed higher.
Possible Retracement Bottom
Recent price action in natural gas leaves several nearby price levels to key off. There is today’s high of 3.115 and the low of 3.035. Also, the 20-Day MA is at 3.06 and the swing low is at 2.98. Today’s high and the swing low are the more critical price levels as a move through either should determine the next direction. Either natural gas continues to rally in alignment with the larger bullish trend or, the bearish correction is not over until lower price levels are tested as support.
A continuation of the rally is signaled on an advance above today’s high of 3.115. That should confirm a bullish reversal and put natural gas in a position to continue to rise and eventually test recent highs, if not break through them. If today’s high is exceeded, then a reclaim of Tuesday’s high at 3.22 will provide the next sign of strength and therefore points to a continuation higher.
Below 2.98 May Lead Lower
On the downside, the next lower target zone is around the convergence of several price targets. There is the top boundary line of a large symmetrical triangle pattern, an extended downside target for the falling ABCD pattern at 2.90, and the 78.6% Fibonacci retracement at 2.875.
Natural Gas Price Forecast
Every new Natural Gas analysis as it publishes, today's technical signal and key levels, live price — on one page.
See all Natural Gas forecastsFor a look at all of today’s economic events, check out our economic calendar.


