


Oversold Conditions Spark a Bullish Reversal
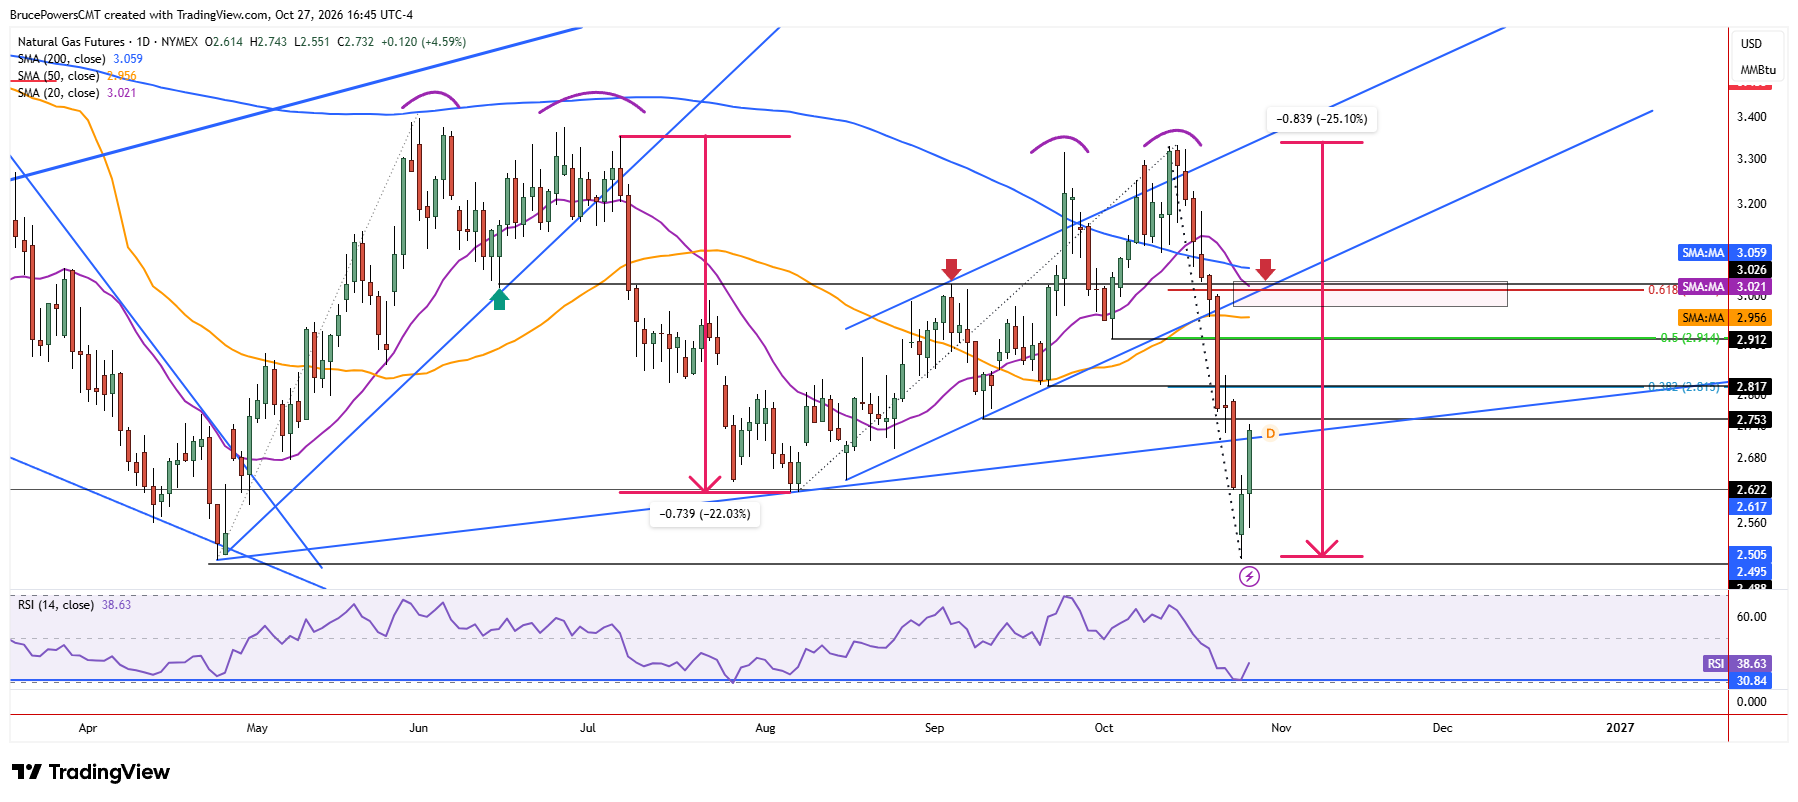
Natural gas signaled a one-day bullish reversal on Tuesday, after finding support near April’s low on during Monday’s session and rallying. The session advanced to a high of $2.74, recovering a short-term trendline following an extension of the decline to a low of $2.50 hit during Monday’s session.
Similar low readings were reached in the relative strength index (RSI) momentum oscillator near the prior three swing lows, and the current downswing showed a decline of around 25% versus the prior fall of around 22%. The speed of the recent decline accelerated to eight days compared to 14 days in the previous move down.
Fibonacci Levels Map Initial Recovery Targets
Last week’s wide range of $3.18 to $2.62 suggests natural gas could spend some time consolidating within that range. There are several upside resistance targets beginning with the higher swing low at $2.74. However, given the oversold indications, that level looks likely to be exceeded on the way to the first confluence zone.
The 38.2% Fibonacci retracement of the prior decline aligns with a higher swing low at $2.82. Above there is the confluence of the 50% retracement level and another higher swing low at $2.91. Those levels are relatively obvious but given the magnitude of the current decline, the countertrend move may also be volatile.
Moving Averages Define Major Resistance
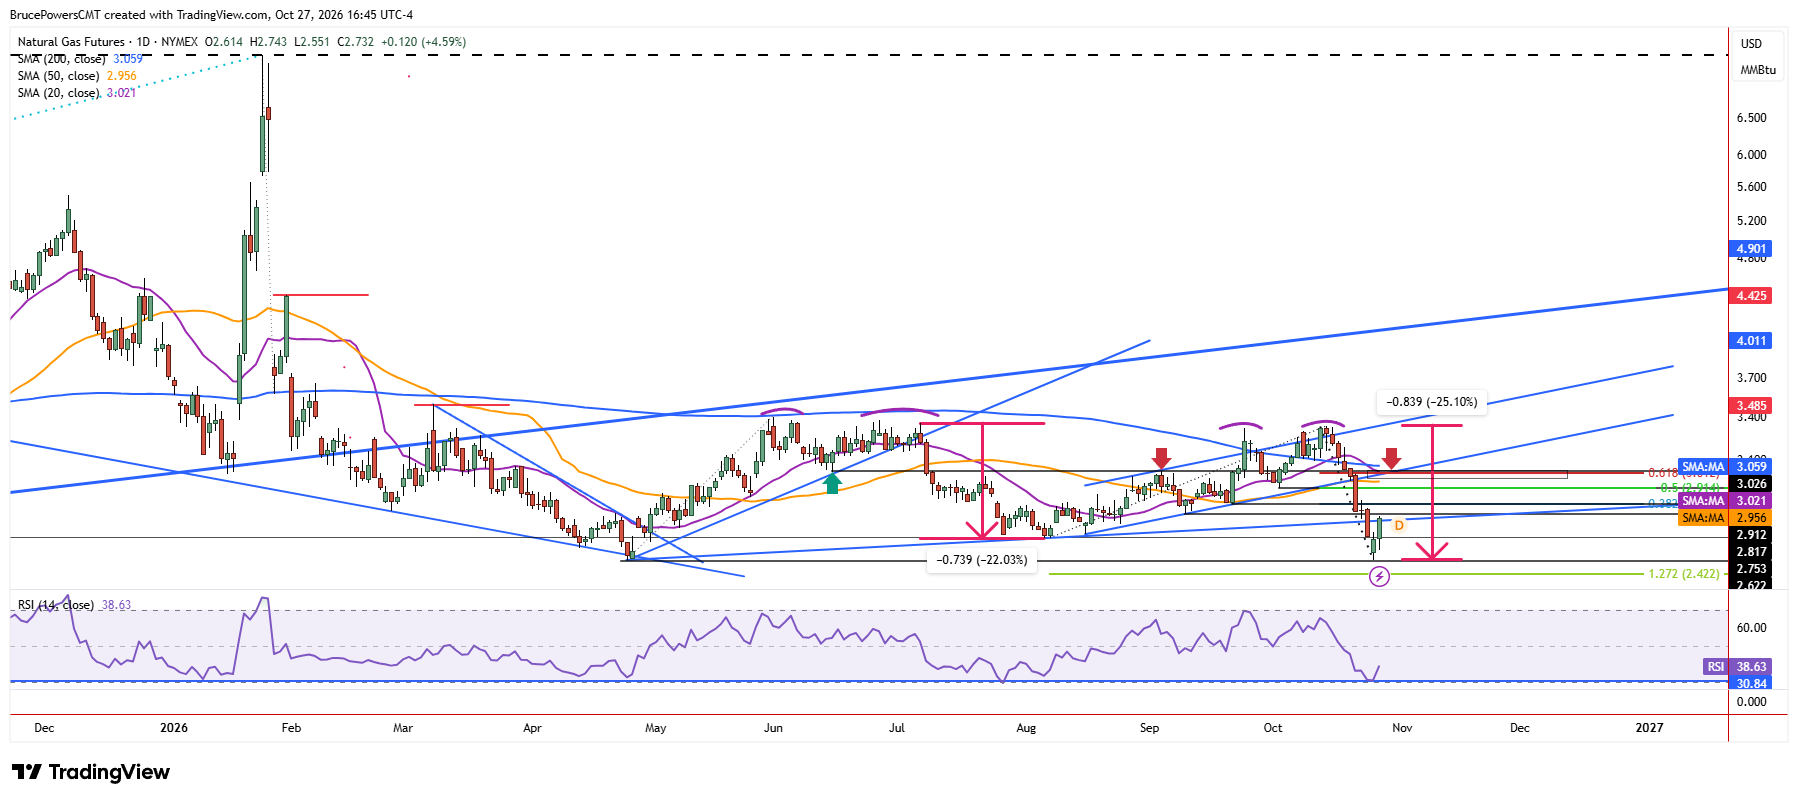
The more significant and higher resistance targets begin with the 50-day moving average near $2.96, particularly since it defined a key level that signal the breakdown from a rising channel last week. The 61.8% Fibonacci retracement at $3.01 marks another resistance level, followed by the 200-day moving average near $3.06 and falling.
Relief Rally or Developing Bottom
So far, the reaction to the sharp decline is a sharp response to the upside. That could continue toward higher prices or a period of consolidation, and a more defined bottom could occur prior to higher targets being reached as well. For now, further strength looks to be in reaction to a slightly oversold market. Whether it turns into more than that remains to be seen.
Natural Gas Price Forecast
Every new Natural Gas analysis as it publishes, today's technical signal and key levels, live price — on one page.
See all Natural Gas forecastsIf you’d like to know more about how to trade natural gas, please visit our educational area.