


Buyers Hold Ground Below Key Resistance
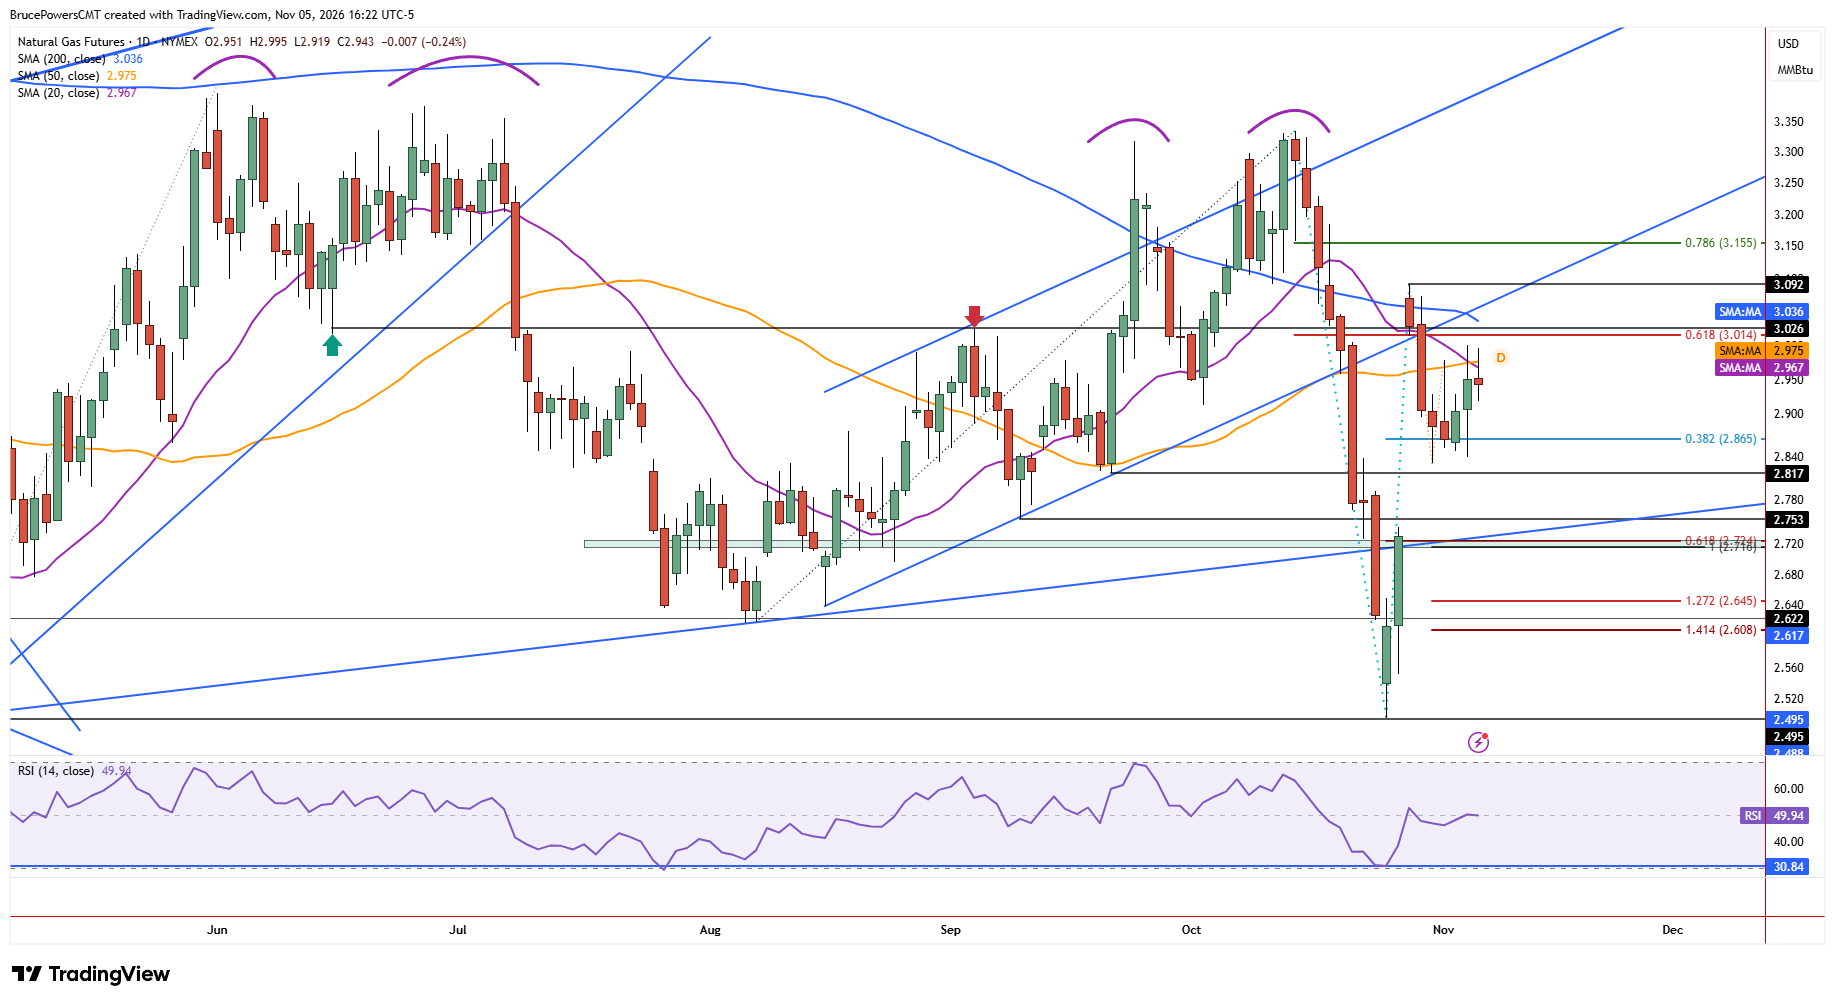
Natural gas remained in a short-term consolidation pattern during Thursday’s session, with a slightly lower daily high of $2.995 and a higher daily low of $2.92. The relatively narrow-range day formed in the upper half of Wednesday’s relatively wide range with a high of $3.00, suggesting that buyers remain in control.
Resistance was tested again near the confluence of the 20-day and 50-day moving average, for the third time in four days. While Wednesday’s high defines the top of the short-term resistance zone, the 20-day moving average has started to cross below the 50-day moving average, reflecting a potential shift toward increasing bearish momentum. This creates a mixed technical picture, with buyers maintaining control of the immediate price structure while overhead resistance continues to limit further gains.
$3.00 Breakout Faces Multiple Resistance Barriers
If a decisive rally above $3.00 occurs, natural gas faces a range of possible resistance from $3.01 to $3.04. The larger dynamic that looks to be developing is the completion of the first pullback and resistance test following the breakdown below a rising channel and the 50-day moving average that triggered on October 21.
The lower rising channel line may now act as resistance, reinforced by other resistance indicators. Furthermore, the 200-day moving average near $3.04 marks another key dynamic resistance area that may be tested. The 200-day moving average has now moved below the lower channel line, adding another layer of resistance and potentially limiting the upside of an initial recovery.
Support Test Could Determine Next Direction
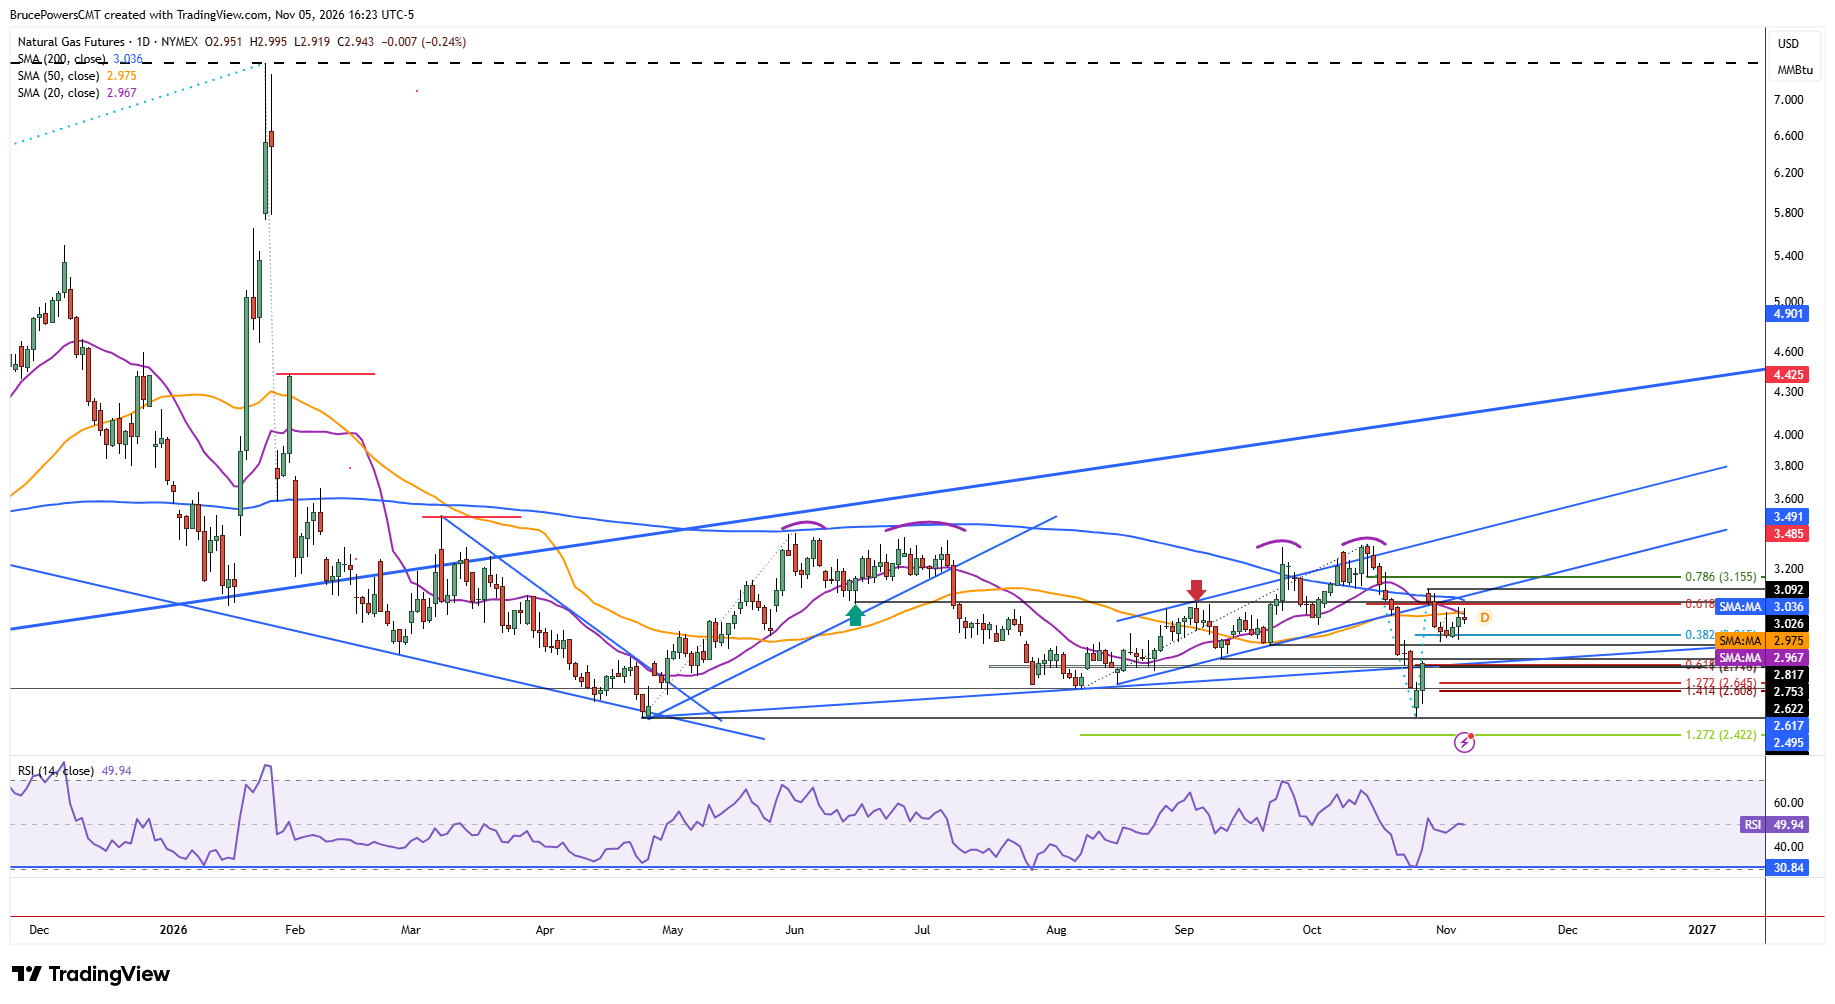
This leaves natural gas vulnerable to further downside, potentially before higher price are tested. The $3.00 high could mark a lower swing high and another leg down. At the same time, support near the recent higher swing low of $2.83 was tested over four days and is reinforced by the 38.2% Fibonacci retracement of the prior advance at $2.865. The ability to hold above this support area will therefore be important in determining whether the current consolidation leads to another recovery attempt or a resumption of the decline.
Broader Pattern Keeps Bearish Risk in Focus
A decline below Thursday’s low of $2.92 would be bearish in the short-term and could lead to another test of support near recent lows. But Wednesday’s wide range increases the chance of continued trading within the $2.84 to $3.00 range that may fail to provide clarity as to the next direction.
Natural Gas Price Forecast
Every new Natural Gas analysis as it publishes, today's technical signal and key levels, live price — on one page.
See all Natural Gas forecastsAlthough buyers currently retain control of the immediate price structure, the broader technical picture favors caution. In general, a larger price pattern impacts a smaller pattern, suggesting that would suggest that downside risk outweighs the potential for a meaningful advance given current price information. Until natural gas can decisively clear resistance near $3.00, the broader bearish structure remains a significant consideration.
If you’d like to know more about how to trade natural gas, please visit our educational area.