


Natural gas rose slightly above Wednesday’s high of 4.01 on Thursday, reaching 4.05 before sellers took back control and prices dropped. Although a continuation of yesterday’s rally was triggered today there was little upside follow through and the day is likely to end with a decline and a close below yesterday’s high.
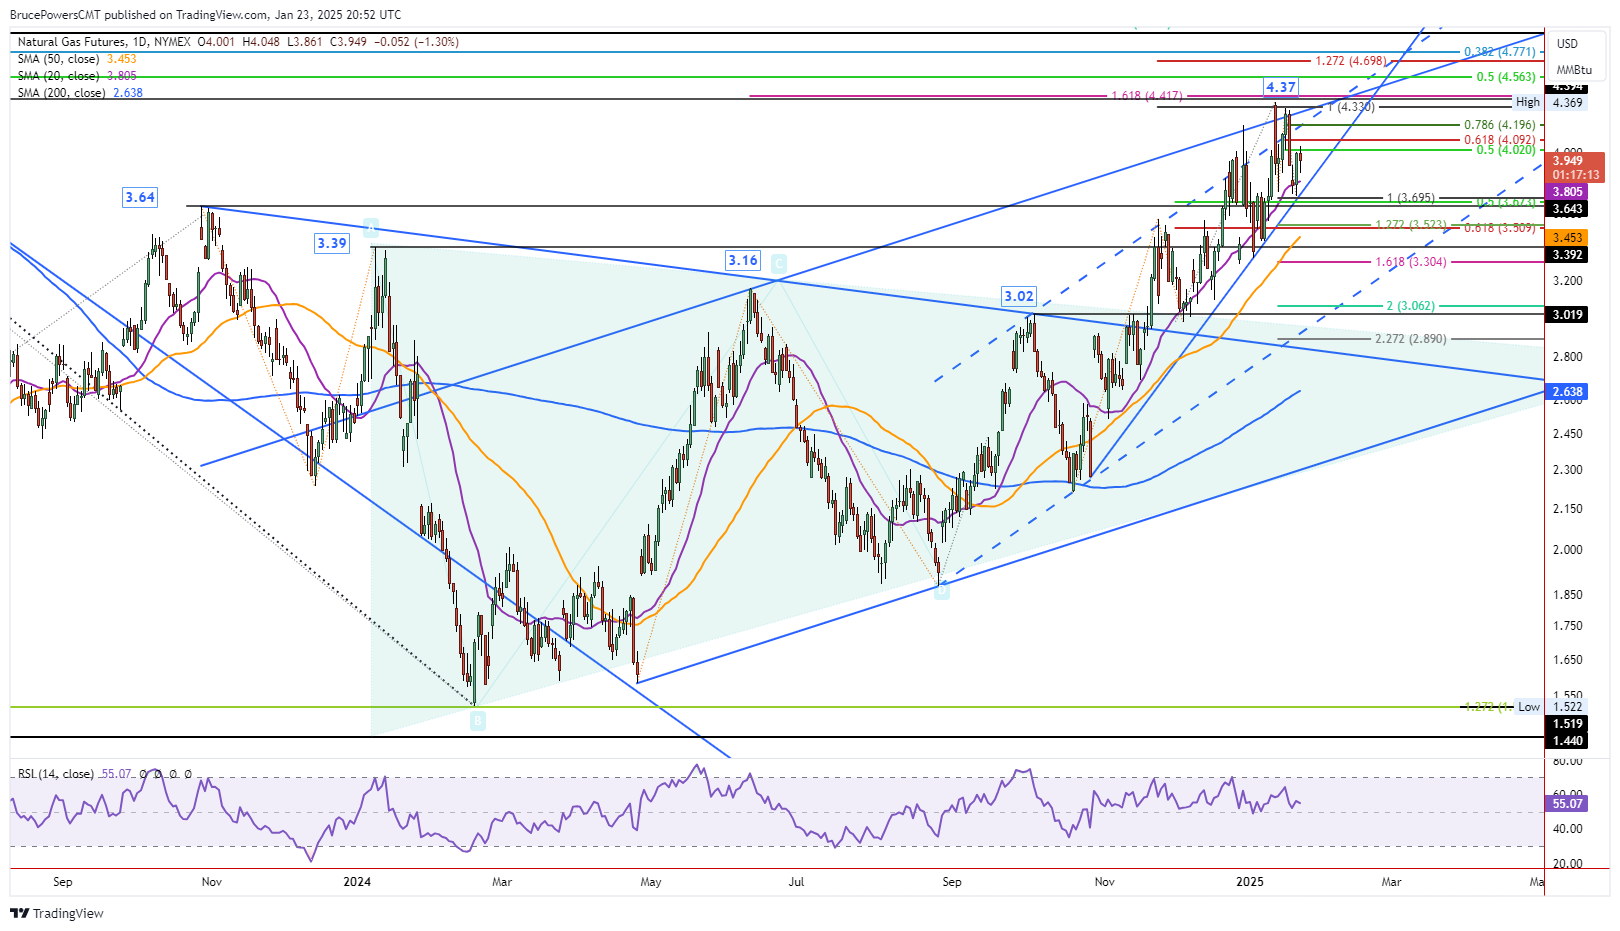
However, natural gas remains in a rising trend channel that showed renewed strength yesterday on a successful retest of support around the 20-Day MA. That advance completed a 50% retracement at 4.02. The day ended with a bullish reversal day and a strong close at 4.00, essentially at the high. Those short-term signs of improving demand have a good chance of continuing, at least for a few days.

Rising into Consolidation
Trading remains within a rough two-week trading range reflecting some degree of consolidation near trend highs. Therefore, volatility may stay muted and choppy for the time being. Today could be a rest day following the bounce yesterday from the 20-Day MA (3.80) support zone that includes the day’s low at 3.71, now a higher swing low. That low is now part of the price structure of higher swing highs and higher swing lows pertaining to the rising trend.
Above 4.05 Shows Strength
A rally above today’s high of 4.05 will signal strength and the possibility of testing higher resistance levels. The 61.8% retracement of the most recent downswing is at 4.09, while a monthly high from December is at 4.20. There is confirmation of the monthly high at the 78.6% retracement, also at 4.20. Resistance could be seen around either of those price areas.
Higher up is a significant price level, a lower swing high and double top at 4.33. That swing high was a little shy of the recent trend high at 4.37. An advance above 4.33 would be needed before there was a clear bullish continuation signal for the trend. Until then the expectation is for resistance to be seen and further fluctuations within a range.
Key Support at 3.71
Nonetheless, a sign of weakening would first be indicated on a drop below this week’s low at 3.71. There is subsequently an identified potential support zone down to 3.64. Consequently, the 3.64 should provide a more significant price level as a drop below it looks like it leads to a lower potential support zone from 3.52 to 3.51. The lower price level is the 61.8% Fibonacci retracement.
Natural Gas Price Forecast
Every new Natural Gas analysis as it publishes, today's technical signal and key levels, live price — on one page.
See all Natural Gas forecastsFor a look at all of today’s economic events, check out our economic calendar.



