


December Natural Gas Reverses After Three-Week High
December natural gas futures gave back early gains on Wednesday and settled lower after touching a three-week high earlier in the session. The selling came in after updated forecasts showed the cold air expected to move into the eastern United States next week may not last long enough to create a major demand event.
Brief Cold Shot Fails to Keep Natural Gas Buyers Chasing
Commodity Weather Group is calling for below-normal temperatures in the East from November 16 through November 20. However, then the forecast turns back toward normal. NatGasWeather sees light demand over the next three days, followed by moderate demand from Friday through Monday. The rest of the country is expected to remain fairly comfortable.
The market needed a longer-lasting cold forecast to keep buyers chasing the rally. Instead, the latest outlook gave longs a reason to take some profits off the table. The rally is not necessarily over, but buyers will need more than a brief cold shot to stay in control.
Storage Build and Record Fund Shorts Set Up the Next Move
Supply remains the other issue. The EIA raised its 2026 dry natural gas production forecast to 113 Bcf per day from 112.2 Bcf per day. Lower-48 dry gas production was estimated at 112.2 Bcf per day on Wednesday, while demand was 79.1 Bcf per day. LNG flows to U.S. export terminals were estimated at 20.6 Bcf per day.
Natural Gas Price Forecast
Every new Natural Gas analysis as it publishes, today's technical signal and key levels, live price — on one page.
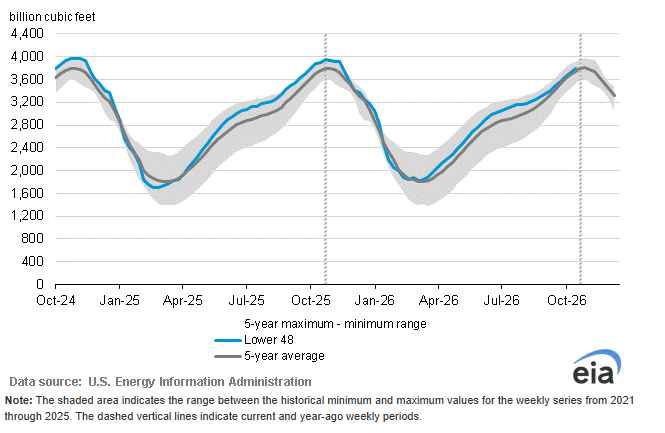
See all Natural Gas forecastsThursday’s storage report is the next major event. Traders are looking for a 65 Bcf build for the week ended November 4. Last week’s 77 Bcf increase topped the five-year average build of 61 Bcf. Inventories were 1.4% above the five-year seasonal average as of October 30, showing supplies remain adequate heading into winter.
The wild card remains the fund position. Hedge funds added 11,426 short positions in the week ended November 3, lifting their net-short position to a record 636,576 contracts. That leaves the market vulnerable to a sharp short-covering rally if colder forecasts return or the storage number comes in tighter than expected.
December Futures Reversal Top Risks 2-to-3-Day Correction to $3.047
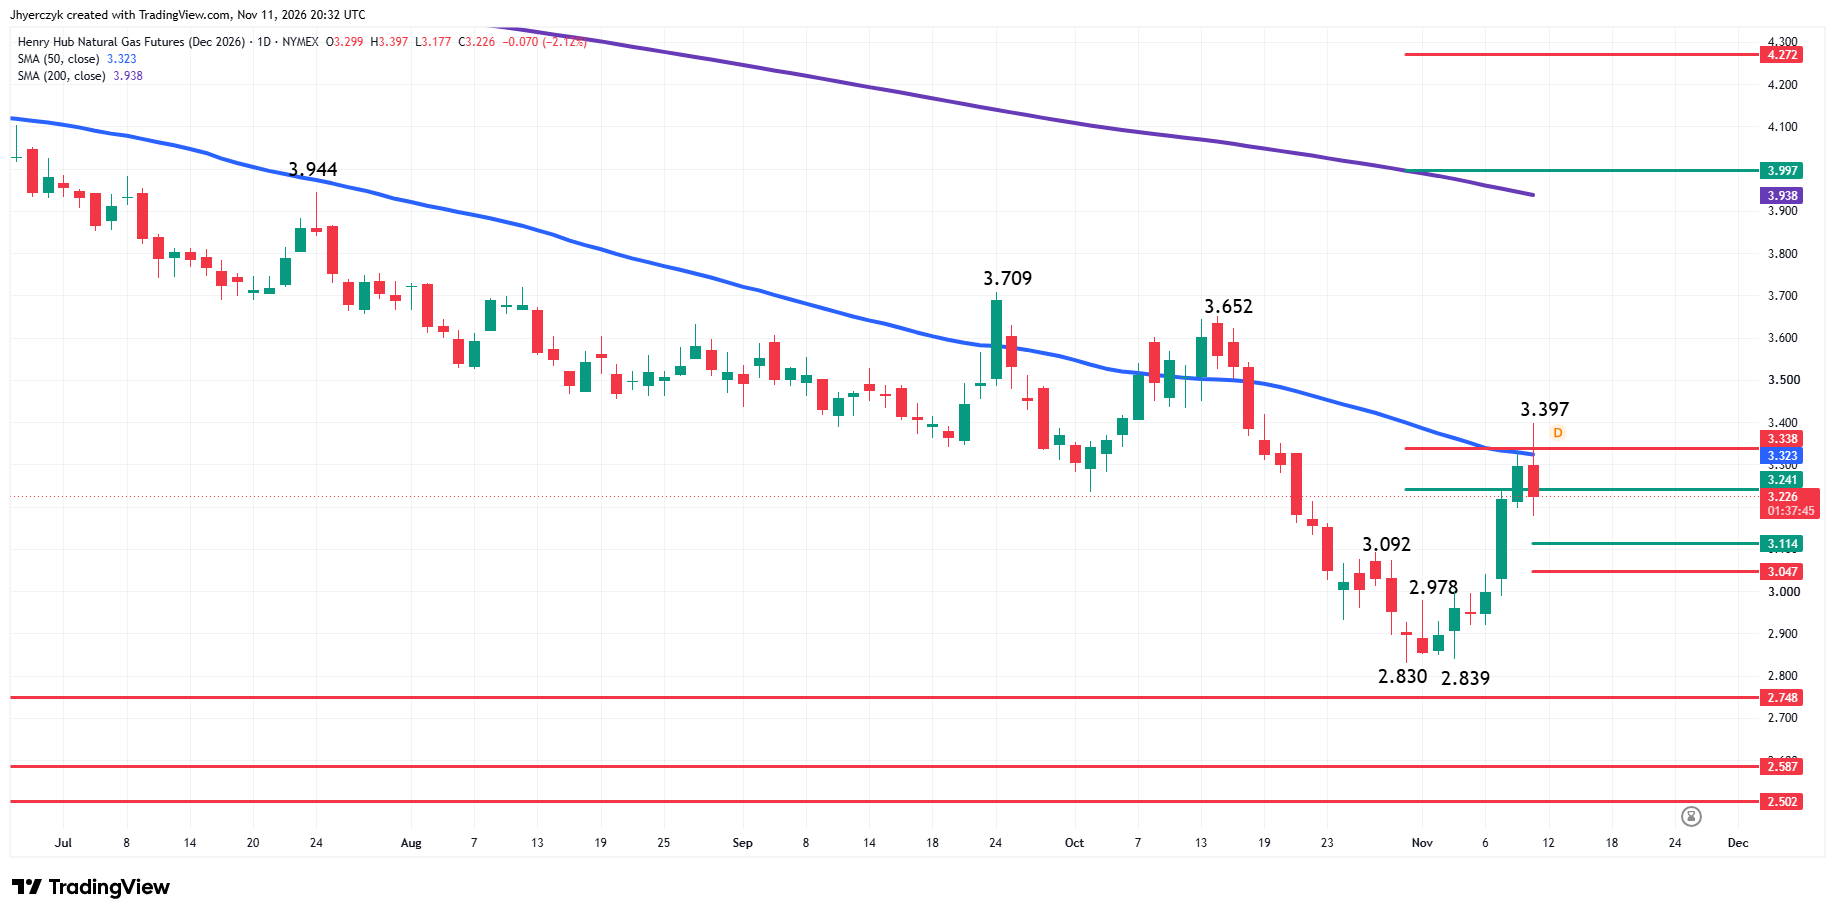
December natural gas futures posted a potentially bearish closing price reversal top on Wednesday after hitting its highest level since October 13 at $3.397.
The main trend is up according to the daily swing chart. A trade through $3.397 will negate the chart pattern and signal a resumption of the uptrend. Taking out $2.830 will change the main trend to down.
A closing price reversal top is not a change in trend. A trade through $3.177 will confirm the chart pattern. This could lead to a 2-to-3-day correction.
The short-term range is $2.830 to $3.397. Its retracement zone at $3.114 to $3.047 is the first downside target.
The intermediate range is $3.709 to $2.830. Its retracement zone at $3.241 to $3.338 was tested early in the session. Although the market pierced the upper level, the rally stalled at $3.397 when the selling commenced. The selling was strong enough to break through the lower or 50% level at $3.241, before a late session rebound.
The long-term range is $5.164 to $2.830. Its retracement zone target is $3.997 to $4.272.
The early session rally also crossed to the strong side of the 50-day moving average at $3.324, but there wasn’t enough buying to sustain the move and the attempt to break out to the upside failed.
What to Watch
My bias was to the upside when the session started because of the uptrend on the swing chart. However, it weakened when natural gas formed the closing price reversal top. A trade through $3.177 will confirm the potentially bearish chart pattern. This will shift my bias to the downside at least temporarily. My near-term objective is $3.114 to $3.047. That’s the next read.
If enough traders come in on a test of $3.114 to $3.047 then a secondary higher bottom could form. If confirmed, this could trigger the start of another rally. If there is enough momentum behind the move then look for an attempt to overtake the 50-day moving average at $3.324, the intermediate 61.8% level at $3.338 and the main top at $3.397. Overcoming all of these headwinds would send a bullish signal.
If $3.047 fails to stop the selling pressure then look for the selling to possibly extend toward the main bottom at $2.830.
Essentially, we’re anticipating a few scenarios. The first is no confirmation of the closing price reversal top and a continuation of the uptrend over $3.397. The second is a confirmation of the chart pattern and a successful test of the retracement zone at $3.114 to $3.047. Third is a confirmation of the chart pattern and a failure to hold $3.047.
More Information in our Economic Calendar.