


Sellers Test Short-Term Control Below Key Resistance
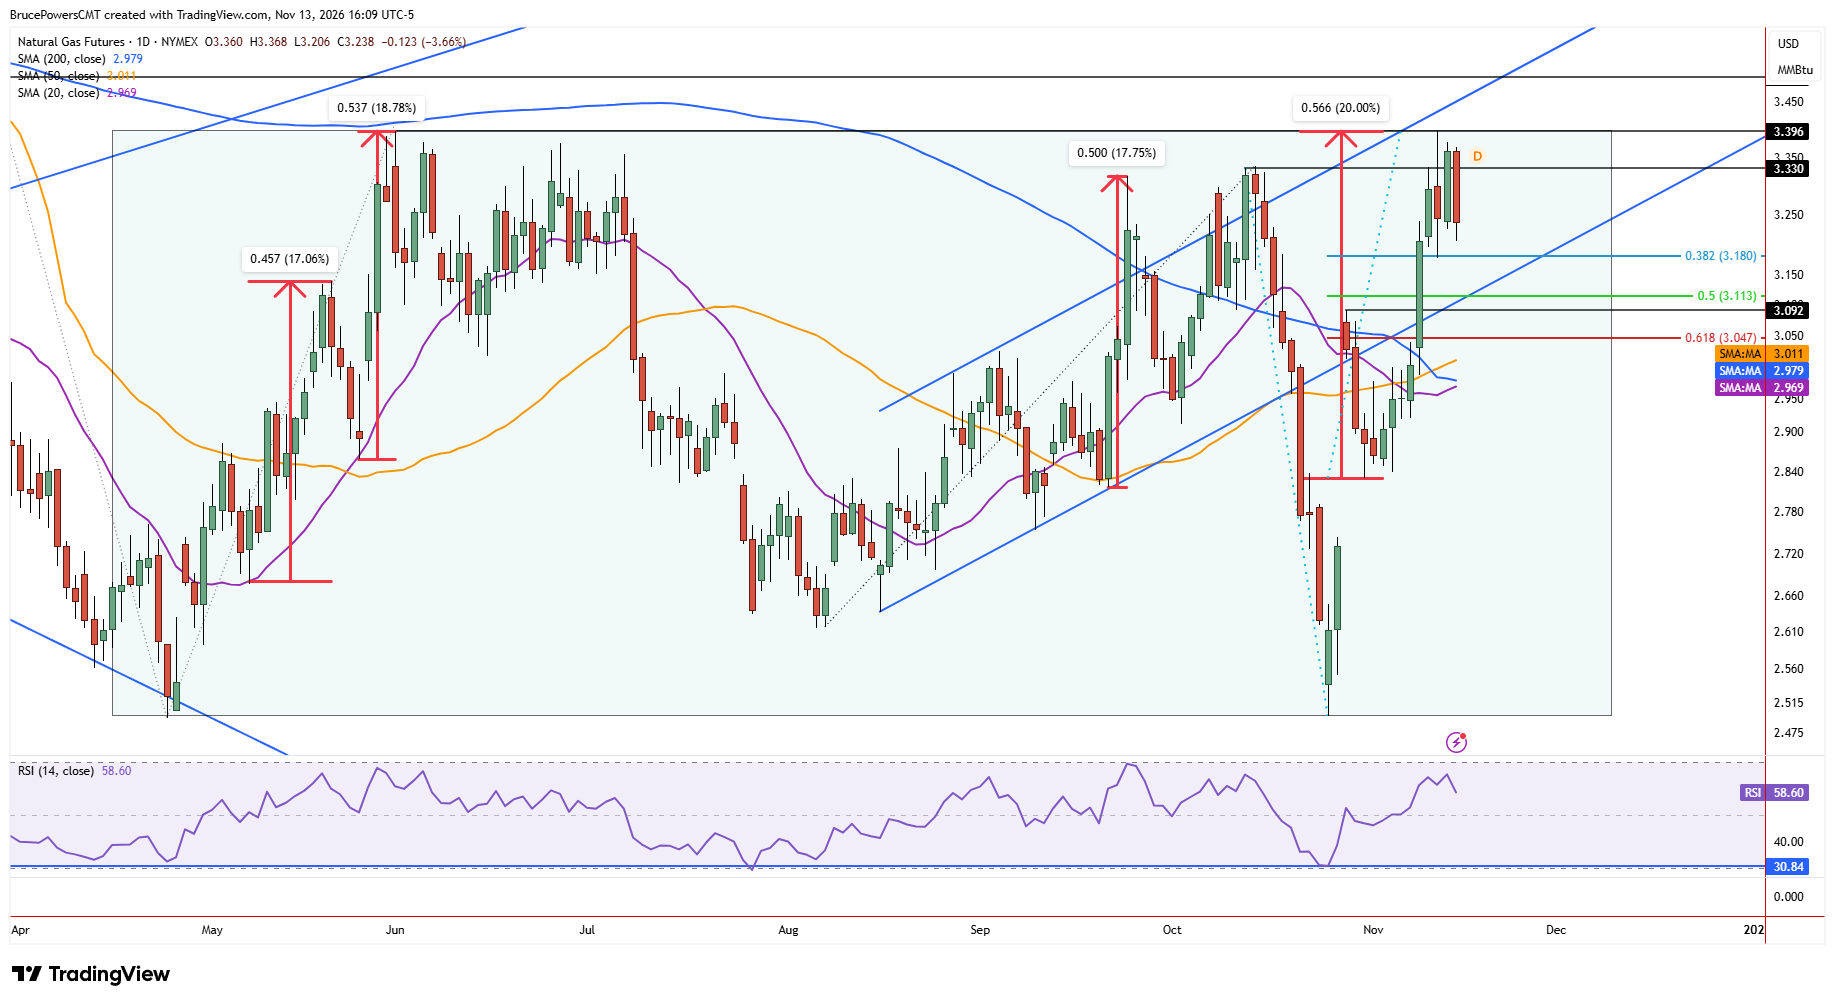
Natural gas continued to consolidate near recent highs on Friday, with a slight downward bias emerging in price action. A lower daily high of $3.37 and lower low of $3.21 were established, following an initial bearish reversal signal below Thursday’s low of $3.23. At the time of writing, natural gas is on track to end the session lower for the day and in the bottom half of the day’s range, leaving sellers temporarily in control. However, the potential bearish implications of this price action remain muted unless sellers force a decline below Monday’s low of $3.18, which is reinforced by the 38.2% Fibonacci retracement of the prior advance.
Rapid 10-Day Rally Shifts Momentum Toward Breakout
This consolidation follows a relatively sharp 20% rally in only 10 sessions to a high of $3.40 on Wednesday. For comparison, the prior two rallies took more than twice as long to reach a top. This acceleration signals improving demand and momentum, raising the possibility of breakout through a key resistance zone at the top of a large rectangle pattern. Therefore, some degree of corrective behavior is healthy for a bullish outlook, as demand needs to build if natural gas is going to sustain gains after breaking out above $3.40, which defines the top of the rectangle.
The consolidation range near the highs is defined by Wednesday’s boundaries of $3.18 and $3.40. A decline through $3.18 could lead to a test of support near a rising trendline or 50% retracement of the prior advance at $3.11. Conversely, given the size of the rectangle and recent signs of strong demand, a decisive breakout could trigger a continuation of upward momentum.
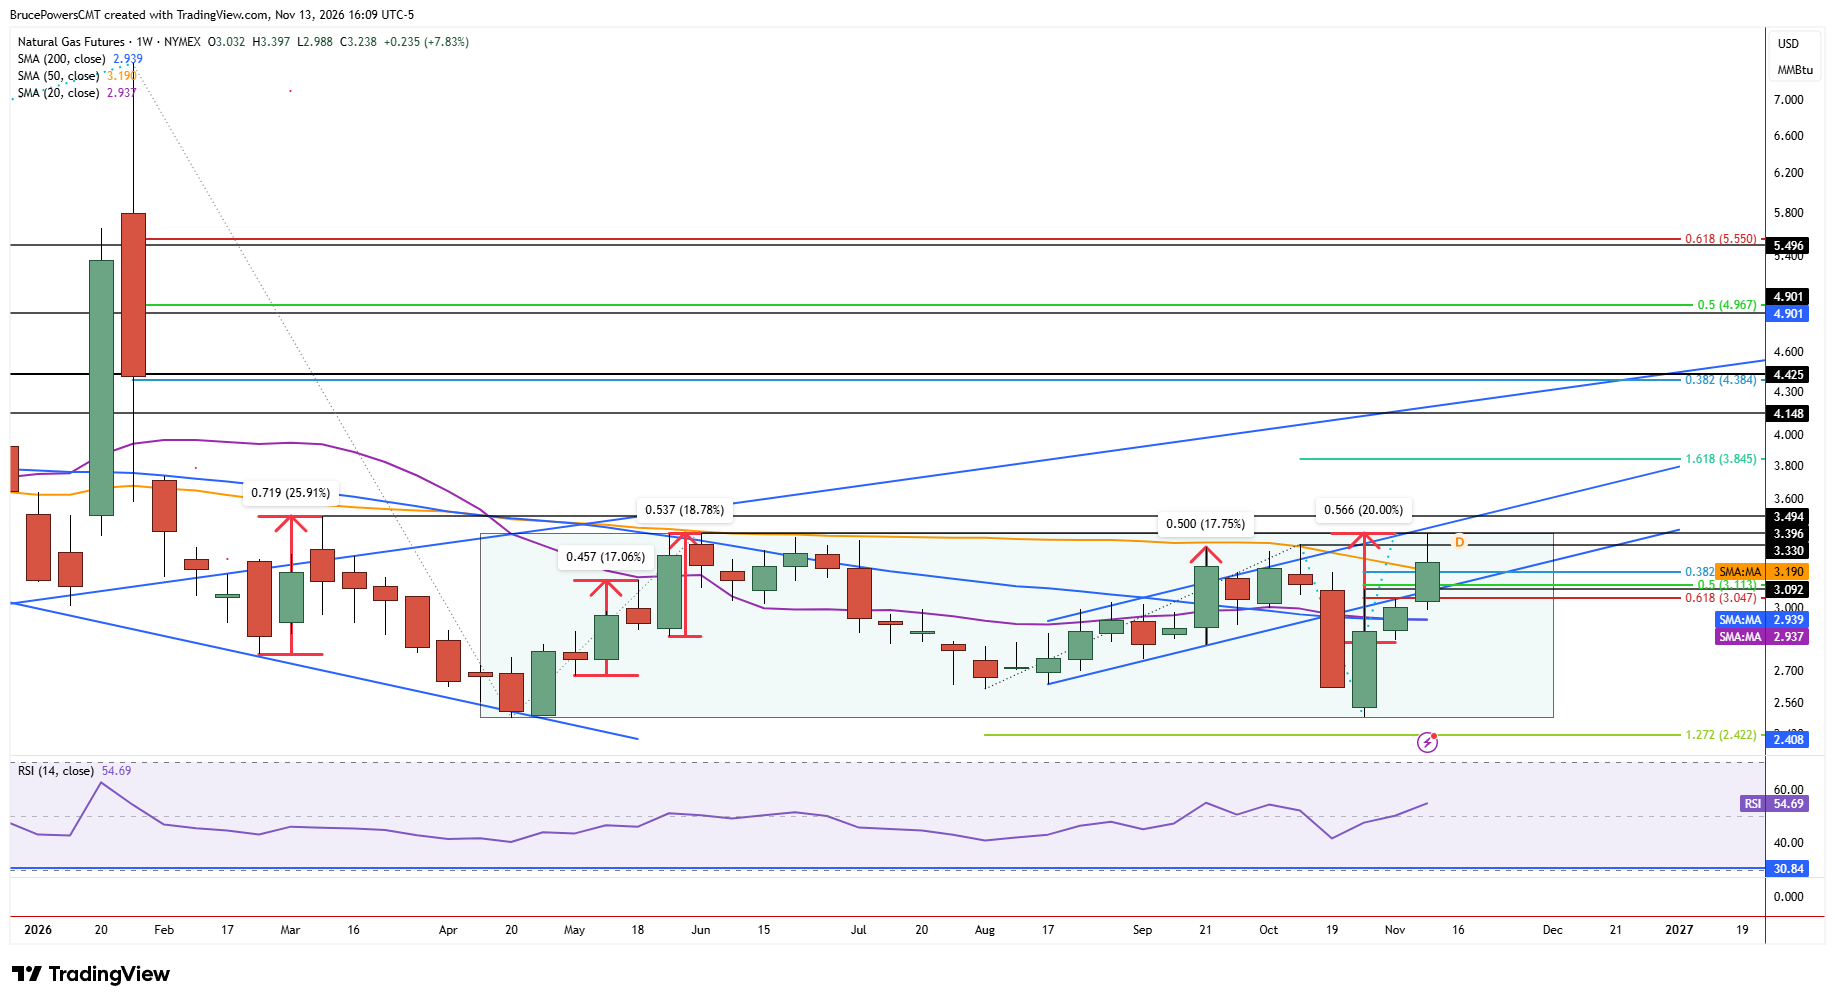
Upside Roadmap Opens Above $3.40
If buyers can reclaim control above $3.40, the first upside target is at the lower swing high of $3.49. Given the long-term consolidation breakout that a push above $3.40 would signal, that level should quickly be exceeded on the way to higher resistance targets, starting with the prior peak at $4.90 from March 2025. After that, each potential target is reinforced by a Fibonacci retracement level of the prior decline that followed January’s spike high of $7.44, proving whether buyers can turn Friday’s minor pullback into a lasting breakout.
If you’d like to know more about how to trade natural gas, please visit our educational area.