


A week-end cold blast over key U.S. demand areas is helping to drive natural gas prices sharply higher early Tuesday. The technical gap on the charts suggests a combination of aggressive short-covering and speculative buying is behind the move.
At 1233 GMT, February Natural gas futures are trading $2.742, up $0.084 or+3.16%.
According to NatgasWeather.com for the December 25 to December 28 time period, “Cold air will sweep across the northern and central U.S. the next few days with lows dropping below 0 degrees Fahrenheit to 20 degrees, with below freezing conditions also pushing into North Texas. The Northeast will be slightly cool while mid high pressure sets up across the rest of the Mid-Atlantic and Southeast. Cold air will push the mild ridge out of the way over the East Coast Christmas Day, with reinforcing frigid cold shots continuing through next week. Overall, demand will be rapidly increasing the next several days to high to very high.”
The U.S. Energy Information Administration (EIA) reported last Thursday that U.S. natural gas stocks decreased by 182 billion cubic feet for the week-ending December 15. The five-year average for the week is a withdrawal of 125 billion cubic feet, and last year’s storage withdrawal for the week totaled 100 billion cubic feet. Natural gas inventories fell by 69 billion cubic feet in the week-ending December 8.
Total U.S. stockpiles fell week over week to 5% below last year’s level and are now 2.4% below the five-year average. The EIA reported that U.S. working stocks of natural gas totaled about 3.444 trillion cubic feet, around 84 billion cubic feet below the five-year average of 3.528 trillion cubic feet and 183 billion cubic feet below last year’s total for the same period.
Working gas in storage totaled 3.627 trillion cubic feet for the same period a year ago.
Forecast
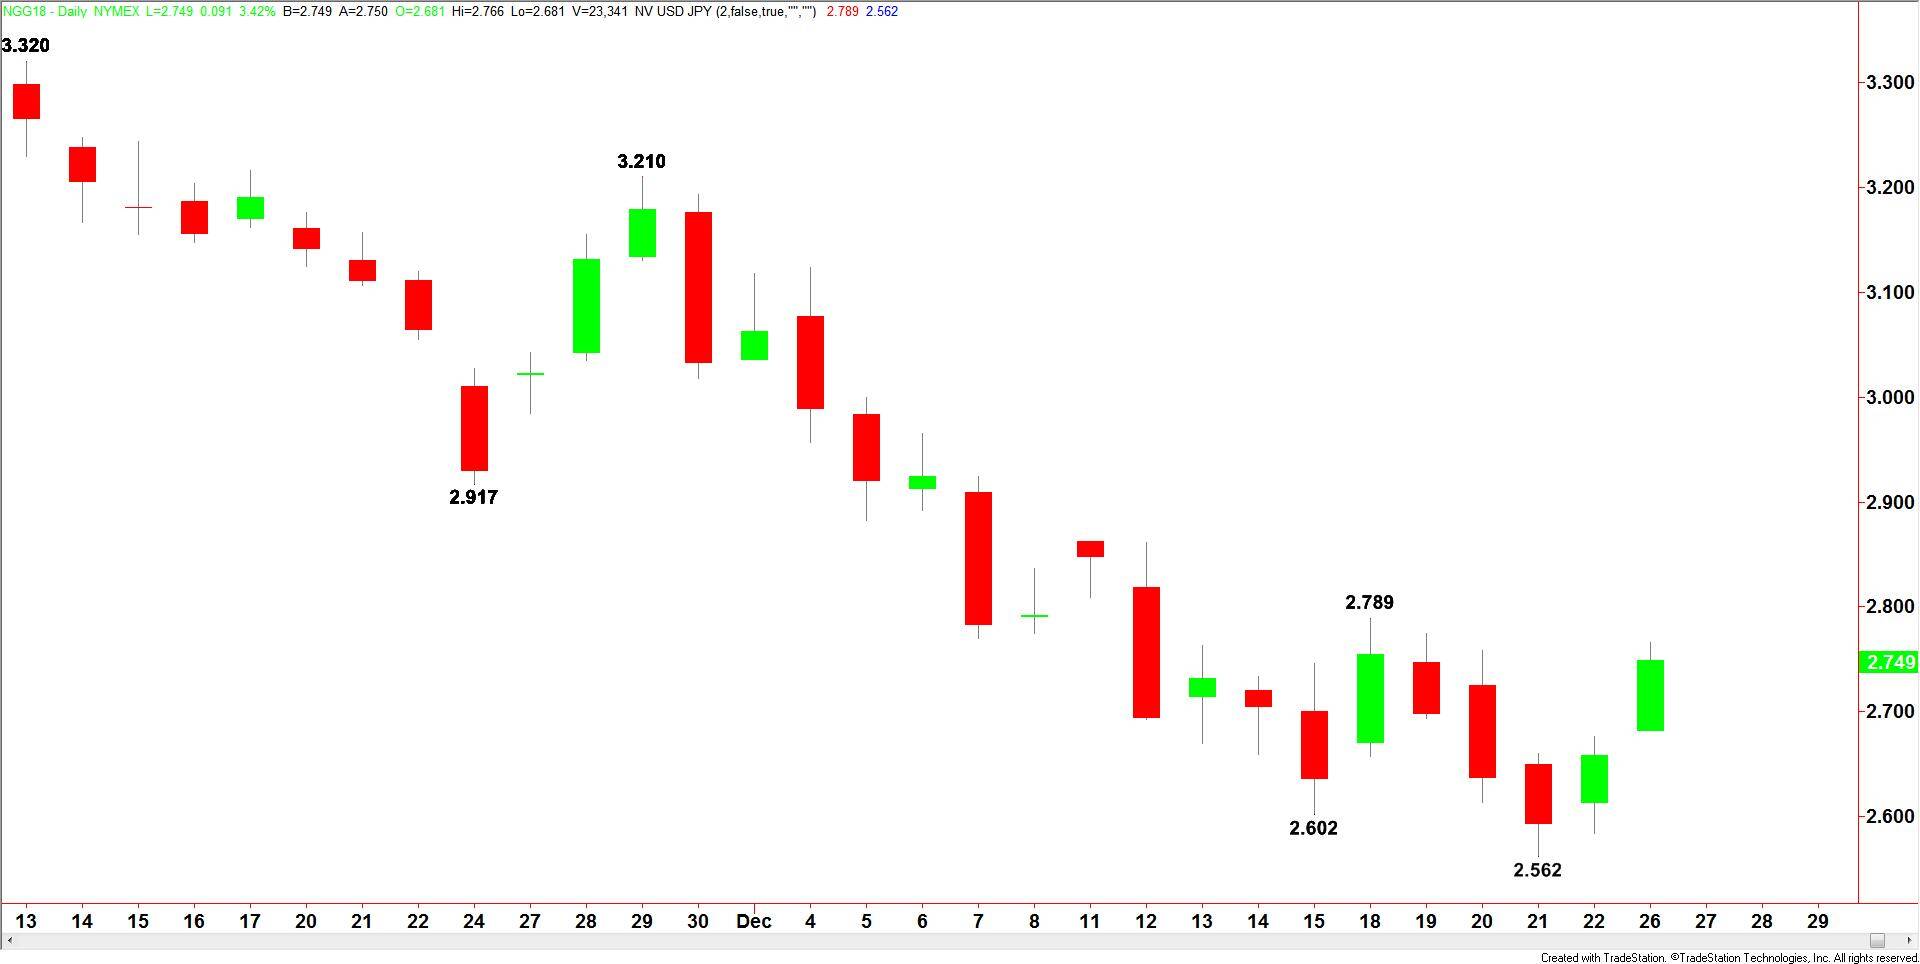
The chart pattern on the weekly chart is potentially bullish due to the formation of a technical closing price reversal bottom. Today’s price action on the daily chart has put the market in a position to change the trend to up, at least temporarily. This could lead to further short-covering into a key retracement zone.
The short-term range is $2.789 to $2.562. A sustained move over its retracement zone at $2.702 to $2.676 will be a sign of strength. Taking out $2.789 will change the main trend to up on the daily chart.
The main range is $3.210 to $2.562. If the move through $2.789 creates enough upside momentum, we could see a rally into $2.886 to $2.962. Sellers are likely to return following a test of this zone.