



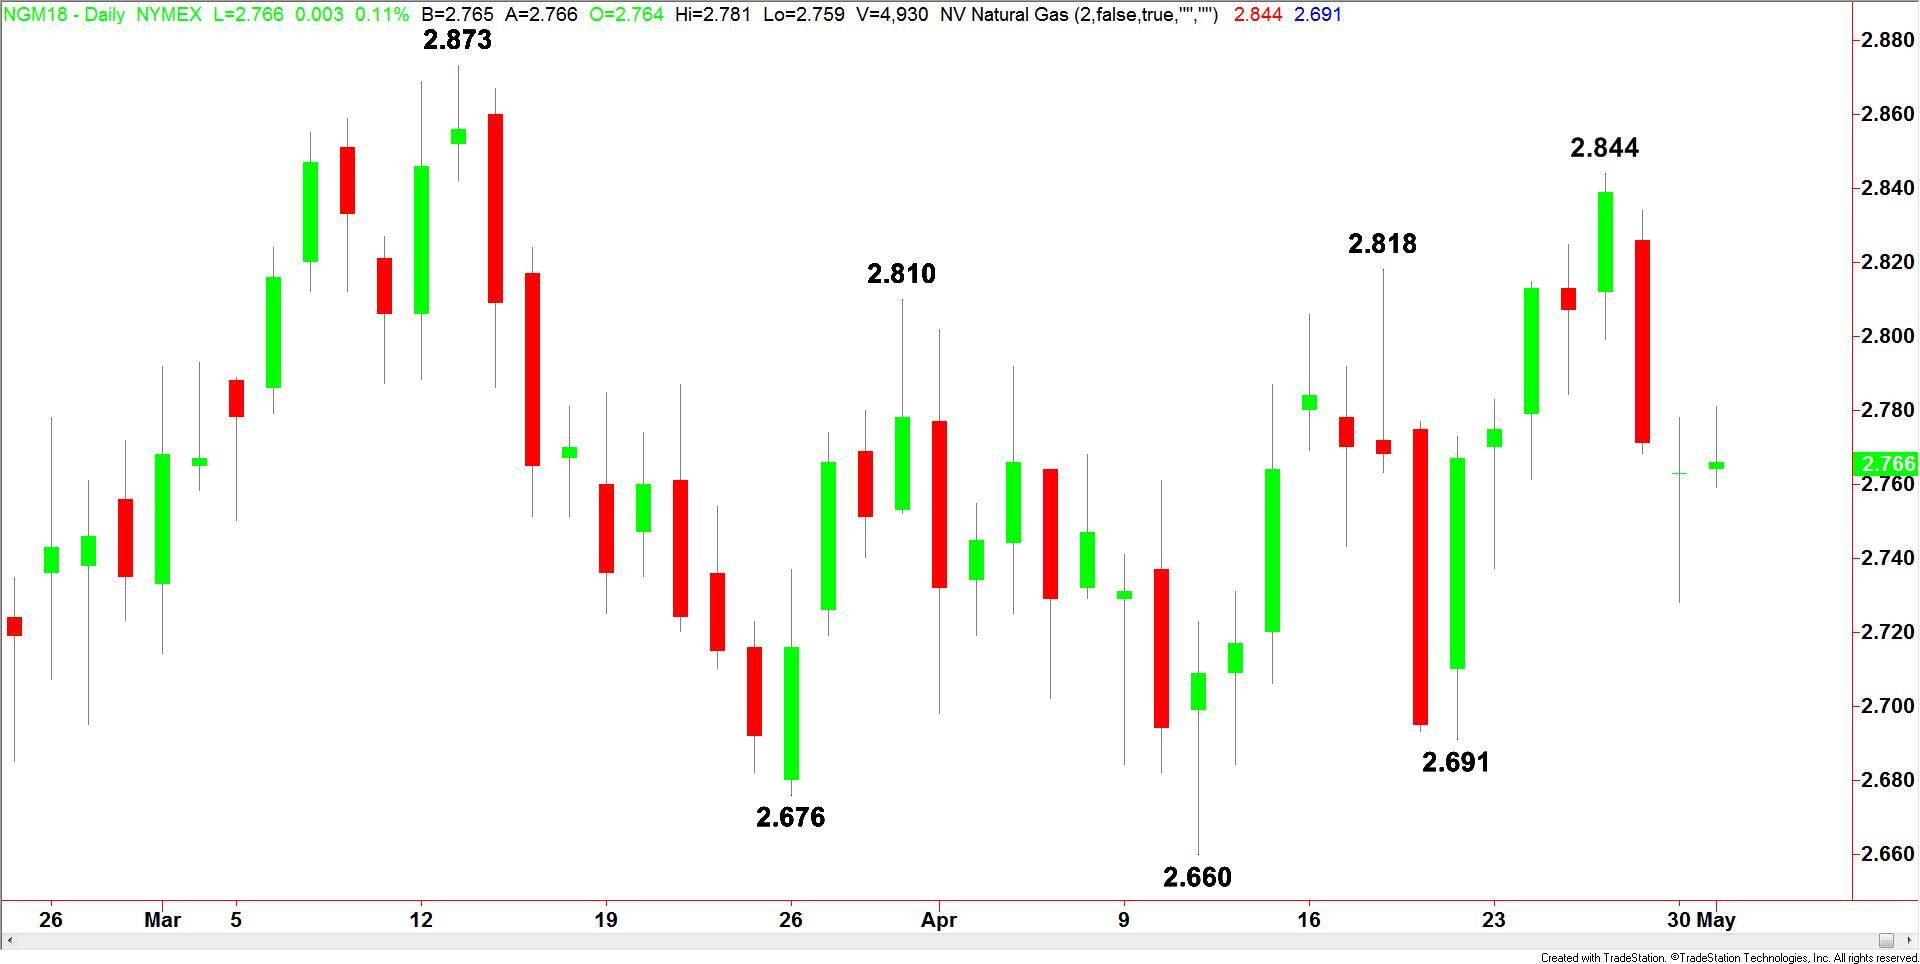
Natural gas traders continued to shake the tree on Monday, producing another two-sided trade in an effort to rattle both bullish and bearish investors. The upside is clearly being defended by aggressive short-sellers, but the downside has been equally protected by aggressive buyers.
The price action suggests that bullish investors are not too concerned about this week’s Energy Information Administration’s report later this week, which is expected to show the first inventories build since early December.
Traders also don’t seem to be too worried about the upcoming change in weather to more favorable spring conditions.
Forecast
There was some follow-through to the upside early Tuesday, but prices quickly retreated to nearly unchanged in limited price action.
At 0919 GMT, June Natural Gas is trading $2.764, up $0.001 or +0.04%.
The NatGasWeather.com people are saying for the May 1 to May 6 period, “….warm high pressure currently over the central and southern U.S. will expand across the North and East this week with highs of 70s and 80s reaching Chicago and New York City for very light demand. Most of the country will see very comfortable temperatures until modest cooling arrives late next weekend across the far northern U.S. Cooler expectations will occur across the West early this week as weather systems bring rain and snow.”
The weather forecast suggests the market is likely to remain rangebound.
Looking ahead to Thursday’s U.S. Energy Information Administration’s weekly storage report, we’re expecting the government report to show a build of about 45 billion cubic feet for the week-ending April 27.
The key level on the chart remains the annual pivot at $2.807. Trader reaction to this level will tell us whether the bulls or the bears are in control.
The short-term range is $2.873 to $2.660. Its 50% level or pivot is $2.766. Trader reaction to this level will also help in determining whether buyers are supporting the market on price dips or selling weakness. This pivot is currently being tested.
Basically, a sustained move over $2.807 will signal an upside bias, while a sustained move under $2.766 will indicate a downside bias.
Holding between the levels will indicate a somewhat neutral market.