Advertisement
Advertisement
Natural Gas Price Fundamental Daily Forecast – Lower as Freeport LNG Outage Weighs on Demand
By:
The bias remains to the upside so we expect buyers to return on a pullback into the best support area and value zone at $8.076 to $7.706.
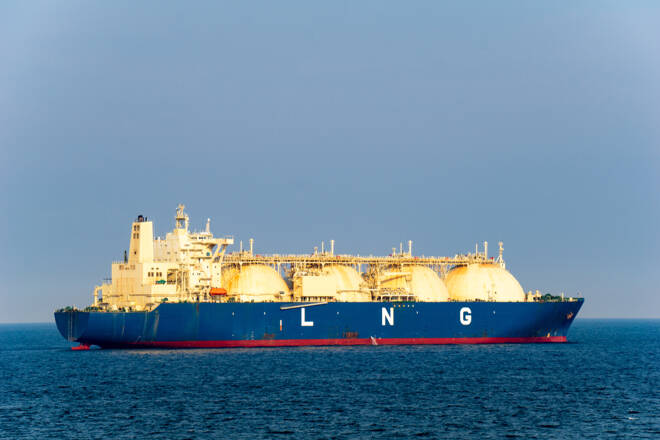
Natural gas futures are trading lower late in the session on Monday as the shutdown of the Freeport liquefied natural gas (LNG) export plant last week cut U.S. demand for gas, leaving more available to refill low stockpiles, and helping to close the deficit between current storage levels and the five-year average.
At 18:37 GMT, August natural gas futures are trading $8.574, down $0.293 or -3.30%. The United States Natural Gas Fund ETF (UNG) is at $29.01, down $0.71 or -2.39%. Early in the session, the futures contract was down about 5% and trading near a two-week low before bouncing from the low of the day.
Traders Still Digesting Impact of Freeport Shutdown
The Freeport liquefied natural gas (LNG) export plant shut down on June 8 after a pipe burst, according to energy research firm IIR Energy and others. Freeport LNG, the plan owner, has said that the plant would be down for at least three weeks of maintenance.
According to Reuters, analysts projected that the Freeport shutdown would reduce the amount of gas available to the rest of the world, especially in Europe where most U.S. LNG has gone in recent months as countries look to wean themselves off Russian supplies after Moscow’s invasion of Ukraine.
Leaving more gas in the United States due to the outage at Freeport should give utilities a chance to rebuild extremely low U.S. stockpiles more quickly. Reuters is reporting that Freeport, the second-biggest U.S. LNG export plant, consumes about 2 billion cubic feet per day (bcfd) of gas, so a three-week shutdown would result in about 42 billion cubic feet (Bcf) more gas being available to the U.S. market.
U.S. storage was currently about 15%, or 340 Bcf, below normal levels for this time of year, its lowest since April 2019.
Daily Forecast
Technically speaking, the main trend is down according to the daily swing chart. It turned down last Thursday when sellers took out the previous main bottom at $8.111. A trade through $9.645 will change the main trend to up.
The minor trend is also down. A trade through $9.161 will change the minor trend to up. This will shift momentum to the upside.
On the downside, the nearest support zone is $8.592 – $8.457. On the upside, the nearest resistance is $8.834 to $9.025.
The longer the market remains inside these two retracement zones, the more volatile the potential breakout.
At this time, the bias remains to the upside. So continue to watch for buyers to come in on dips into major support areas. The best support area and value zone is $8.076 to $7.706.
About the Author
James Hyerczykauthor
James Hyerczyk is a U.S. based seasoned technical analyst and educator with over 40 years of experience in market analysis and trading, specializing in chart patterns and price movement. He is the author of two books on technical analysis and has a background in both futures and stock markets.
Advertisement
