


Natural gas futures are trading nearly flat early Friday following the previous session’s steep sell-off. Today’s early move is likely related to short-term technically oversold conditions and trader defense of a pair of main bottoms at $2.691 and $2.660.
At 1021 GMT, June Natural Gas is trading $2.726, unchanged.
On Thursday, the U.S. Energy Information Administration reported that domestic supplies of natural gas rose by 62 billion cubic feet for the week-ended April 27. That was the first weekly increase in this year’s delayed injection season. Traders expect inventories to continue to build until there is strong summer cooling demand.
Analysts surveyed by S&P Global Platts had forecast a climb of 49 billion cubic feet, and on average over the last five years for the same week, inventories rose by 69 billion cubic feet.
Total stocks now stand at 1.343 trillion cubic feet, down 903 billion cubic feet from a year ago, and 534 billion below the five-year average, the government said.
This report was expected to generate a volatile response because of the wide range of estimates for this week’s report.
A Reuters survey of traders and analysts on average called for the EIA to report a 52 Bcf injection into Lower 48 gas stocks for the week-ending April 27, with responses ranging from 40 Bcf to 68 Bcf.
A Bloomberg survey produced a median build of 51 Bcf, with responses ranging from 40 Bcf to 62 Bcf.
IAF called predicted a 52 Bcf injection. Genscape forecasts a build of 55 Bcf and the ICE Exchange is looking for and injection of 55 Bcf.
Essentially, the market reacted as expected. It went down because the EIA report exceeded the consensus estimate, but losses were limited because the number fell within the range.
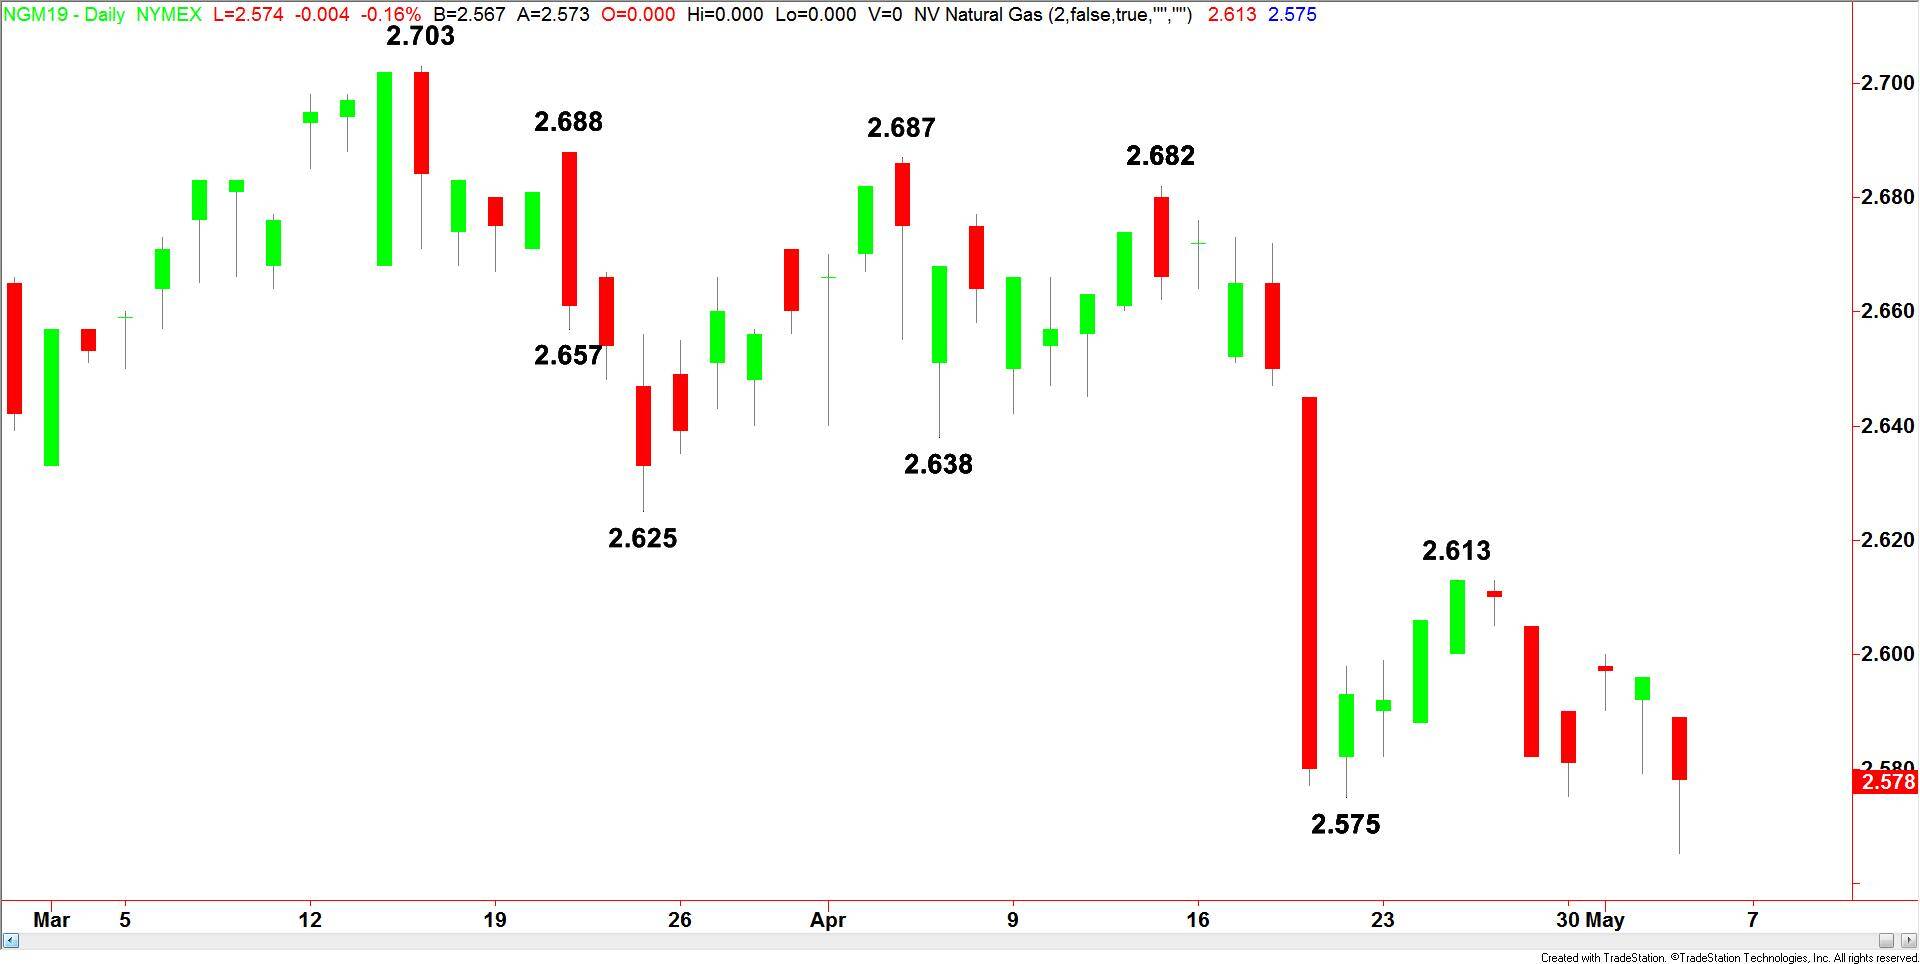
Once again, we’re going to revert to the chart. The range for the year is $2.975 to $2.638. Its mid-point is $2.807. Trader reaction to this level will determine the near-term direction of the market.
Trading on the weak side of $2.807 is helping to generate the downside pressure, but losses are being limited by a series of bottoms at $2.660, $2.650 and $2.638.
We expect storage to continue to build as long as temperatures remain steady. However, the speed at which the storage deficit is being filled is generating some speculative buying. This is what is helping to keep the market afloat.