


Natural Gas Forecast Video for 20.06.23 by Bruce Powers
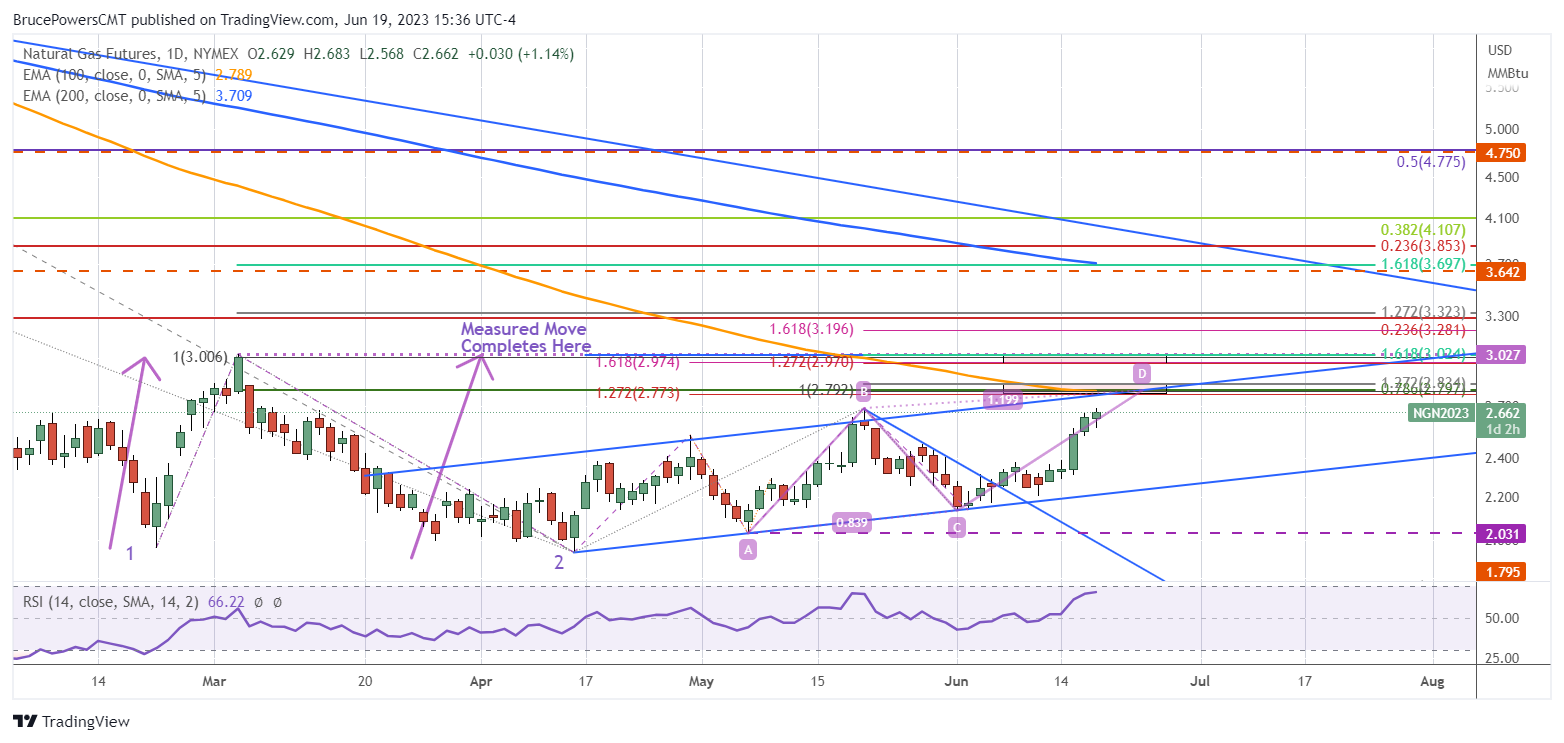
Natural gas advances further to put in another higher daily low and higher high. It is pushing right up against resistance from the most recent swing high at 2.685, as today’s high is 2.683. Further, today’s advance signaled a breakout of last week’s high of 2.65. A more bullish indication will occur if it can also close above that high. Also bullish, last week ended at the highest weekly close since late-February. A move above the recent swing high will also trigger a monthly breakout as May’s is 2.685.
Chance of Reaching Start of Next Target Zone from 2.77 Increasing
Natural gas is on track to reach its first target zone near the top of the ascending parallel trend channel from 2.77 to 2.83. That area increases in significance due to the confluence of several indicators. The 100-Day EMA is one. It is currently at 2.79. Natural gas has been largely below the line since December of last year.
First Approach of 100-Day EMA May Show Signs of Resistance
This rally would be the first test of the line as resistance since then. Once a long-term moving average, such as the 100-Day or 200-Day, is first approached after being away from the lines, price will typically be rejected. In this case, that would mean there is a good chance that the area of the 100-Day line will act as an area of resistance for this rally. Nevertheless, a decisive daily close above the 100-Day EMA or the top of the resistance zone at 2.83, is a sign of strength that could lead to a continuation of the rally into the next higher target zone.
Second Higher Target Zone
The higher target zone is from around 2.97 to 3.03. It is anchored by the prior resistance peak at 3.03 from early-March. This price zone includes several Fibonacci levels and the completion of a large measured moved, starting from the swing low in April (2). If it completes it will reflect symmetry between swings, where the distance from the April low matches the advance off the initial trend low in February on a percentage basis. A match occurs at 3.00.
For a look at all of today’s economic events, check out our economic calendar.