
Advertisement
Advertisement
Natural Gas Technical Report for February 27, 2017
By:
Natural gas prices edged higher on Friday but continues to form a bear flag pattern. This is a continuation pattern, which is a pause that generally
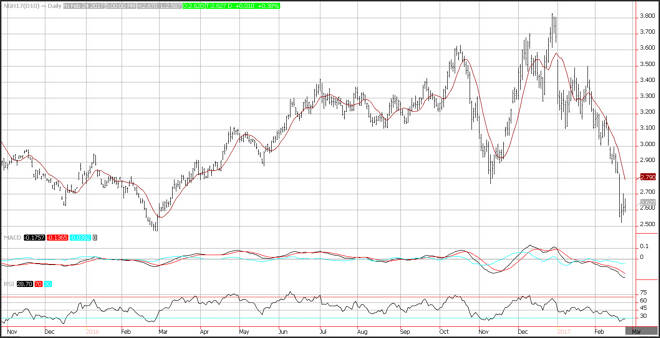
Natural gas prices edged higher on Friday but continues to form a bear flag pattern. This is a continuation pattern, which is a pause that generally refreshes. Prices tumbled mid-week, following a warmer than normal forecast which covers most of the United States, which saw prices drop more than 9.5%. According to the National Oceanic Atmospheric Administration, the weather over the next 8-14 days is expected to be warmer than normal. This should reduce natural gas demand and cap any upside.
Natural Gas is Oversold
Support is seen near the weekly lows at 2.52. A break of this level would lead to a test of target support near the February 2016 lows at 2.47. Momentum remains negative as the MACD (moving average convergence divergence) index prints in the red with a downward sloping trajectory which points to lower prices. The relative strength index (RSI) is printing a reading of 29, below the oversold trigger level of 30 and could foreshadow a correction.
About the Author
David Beckerauthor
David Becker focuses his attention on various consulting and portfolio management activities at Fortuity LLC, where he currently provides oversight for a multimillion-dollar portfolio consisting of commodities, debt, equities, real estate, and more.


Advertisement