



Natural Gas Gains Ground As Traders Buy The Dip
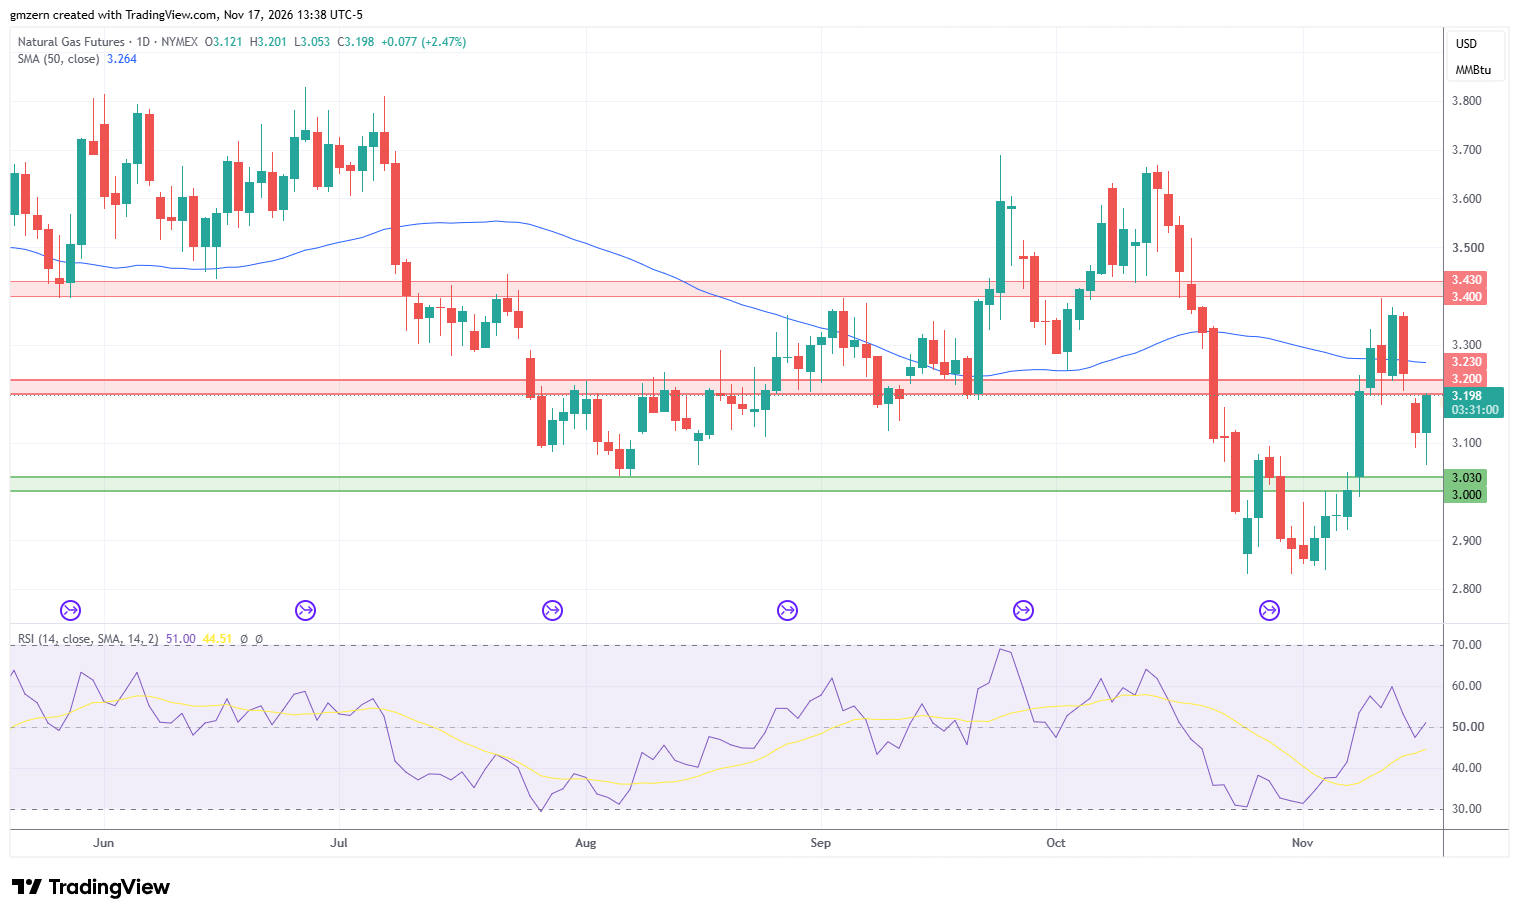
Natural gas rebounds after pullback as traders buy the dip despite mild weather forecasts.
Currently, natural gas is trying to settle above the resistance level at $3.20 – $3.23. In case this attempt is successful, natural gas will head towards the 50 MA at $3.26. A move above the 50 MA will open the way to the test of the next resistance at $3.40 – $3.43. RSI is in the moderate territory, so there is plenty of room to gain additional momentum in case the right catalysts emerge.
On the support side, a move below the $3.10 level will push natural gas back towards the support level at $3.00 – $3.03. If natural gas declines below $3.00, it will head towards the $2.85 level.
WTI Oil Rebounds Amid Rising Geopolitical Premium
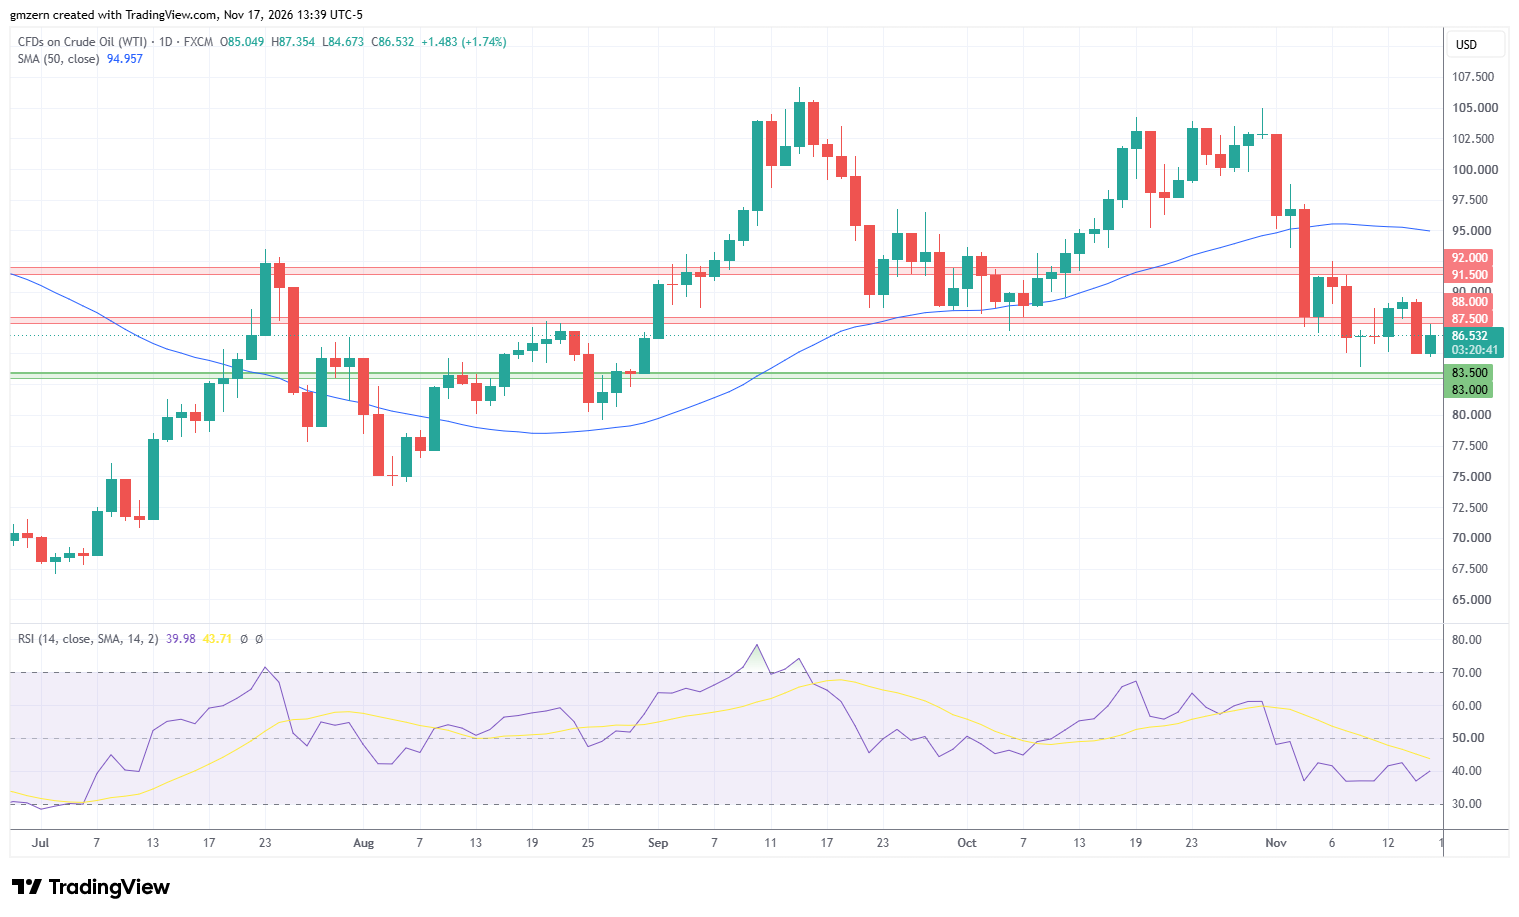
WTI oil gains ground as traders focus on rising tensions in the Middle East. U.S. attacked several sites on Iran’s Qeshm Island in the Strait of Hormuz. In turn, Iran attacked Bahrain, which hosts U.S. military assets. Iran has also attacked vessels in the Strait of Hormuz.
Not surprisingly, risk premium increased, which was bullish for oil markets. However, it remains to be seen whether President Trump is ready to restart the military operation against Iran. U.S. and Iran continue to attack each other, but these attacks are limited, and do not turn into a full-scale conflict. Meanwhile, oil supply continues to increase, which is bearish for oil markets.
The nearest resistance level for WTI oil is located in the $87.50 – $88.00 range. If WTI oil climbs above the $88.00 level, it will head towards the psychologically important $90.00 level. A move above $90.00 will open the way to the test of the resistance at $91.50 – $92.00. In case WTI oil manages to settle above the $92.00 level, it will head towards the 50 MA at $94.95.
Brent Oil Tests The $93.50 Level
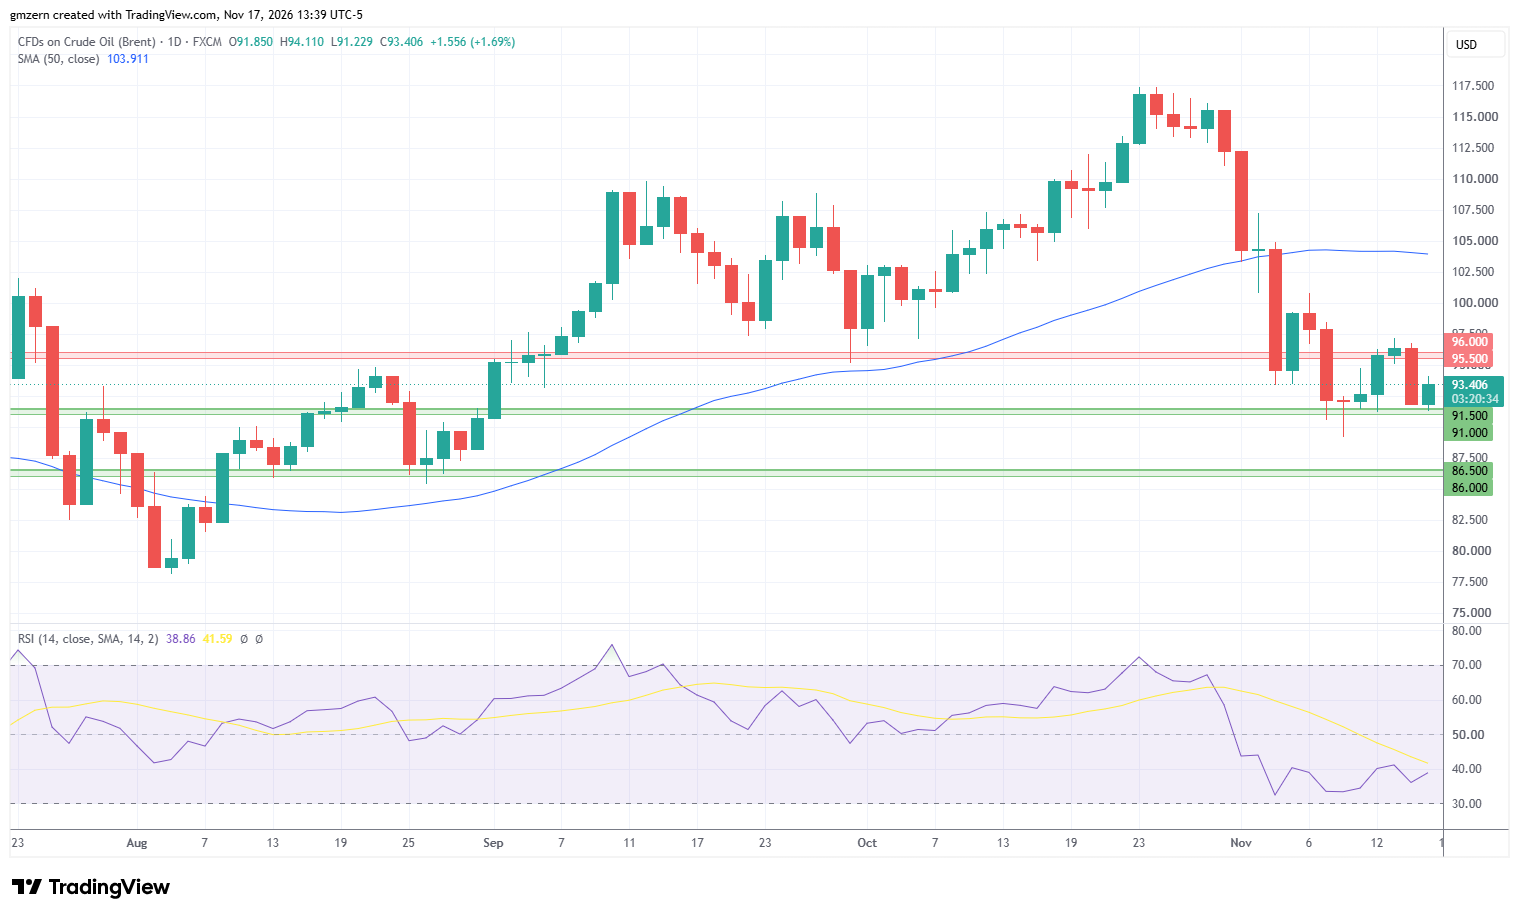
Brent oil has also rebounded after yesterday’s pullback as traders focused on risks of additional escalation in the Middle East.
Natural Gas Price Forecast
Every new Natural Gas analysis as it publishes, today's technical signal and key levels, live price — on one page.
See all Natural Gas forecastsIt remains to be seen whether U.S. and Iran are ready for serious negotiations. U.S. may try to put additional economic pressure on Iran to force the country to discuss its nuclear program. However, Iran may prefer to escalate to improve its negotiating position. Put simply, the risks of additional escalation stay high, but traders also focus on recent bearish changes in supply/demand balance.
Brent oil failed to settle below the support at $91.00 – $91.50 and is trying to climb above the $93.50 level. In case this attempt is successful, Brent oil will head towards the nearest resistance level at $95.50 – $96.00 A successful test of this level will open the way to the test of the psychologically important $100.00 level.
If you’d like to know more about how commodity markets work, please visit our educational area.