INTC Technical Analysis
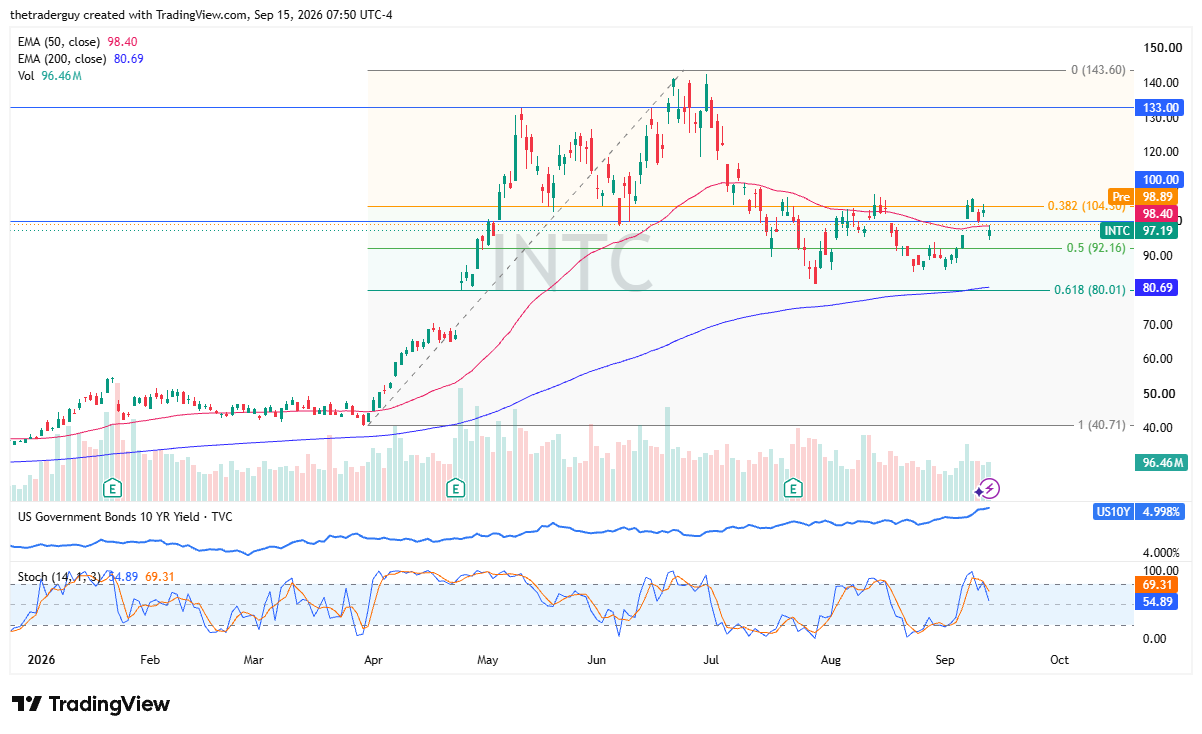
Intel is a little higher in pre-market trading, but recently we’ve seen some noise as broad semiconductor de-risking continues to be one of the stories here. Intel itself has been a fairly successful story over the last year as the turnaround continues for the company.
AI industry leaders got crushed. Perhaps the prospect of slowing frontier model development, as thrown out there by multiple leaders in the industry, has spooked the markets. Investors immediately figured that slower data-center CapEx and semiconductor demand would be part of that. It is a little overdone. It’s just a few words, but it looks like the market is trying to turn things around.
Furthermore, you have to keep in mind that interest rates being higher than anticipated has been a bit of a drag.

NVDA Technical Analysis
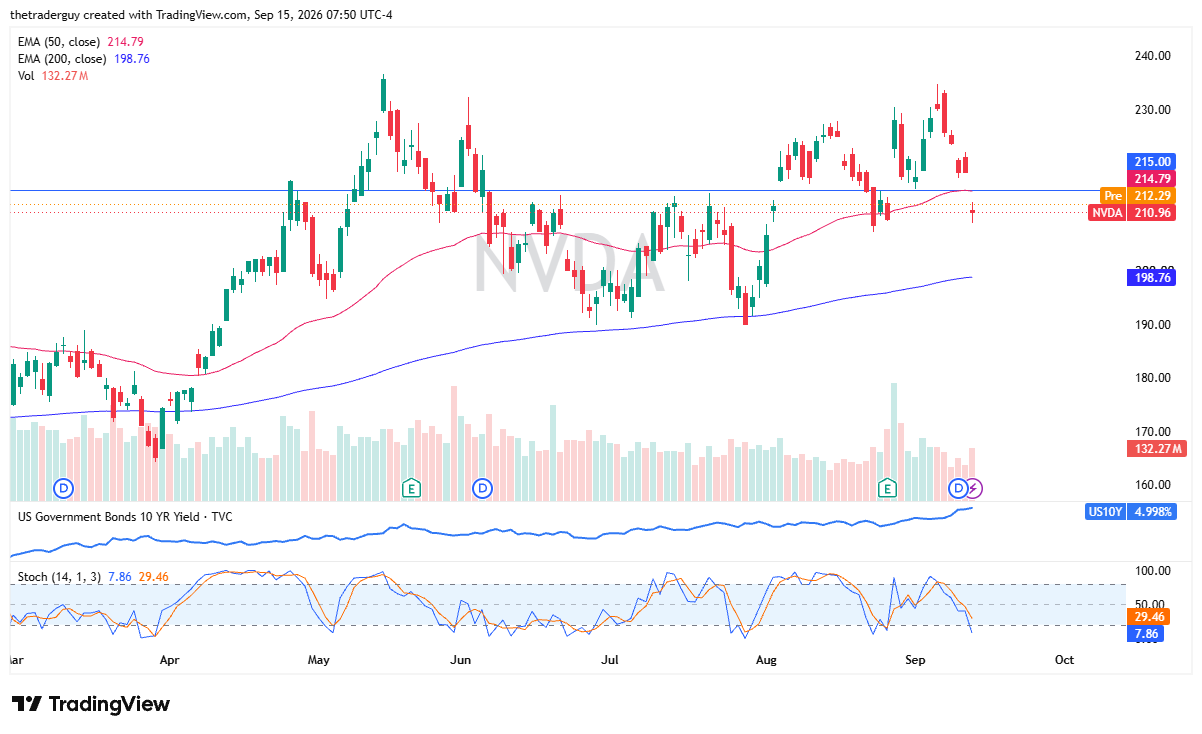
NVIDIA looks slightly positive in early market trading, with the market trying to reach toward the 50-day EMA. Again, this is about anxiety, with AI capital expenditures being the immediate problem. After all, if fewer data centers were to be built, NVIDIA is directly hit.
The market is looking at this in more fear-than-fact-based terms because NVIDIA’s actual business numbers remain extraordinarily strong. So really, rates and the fear of a slowdown are fighting the reality of growth and economic numbers in this company that remain truly envy-worthy of most others.
AMD Technical Analysis
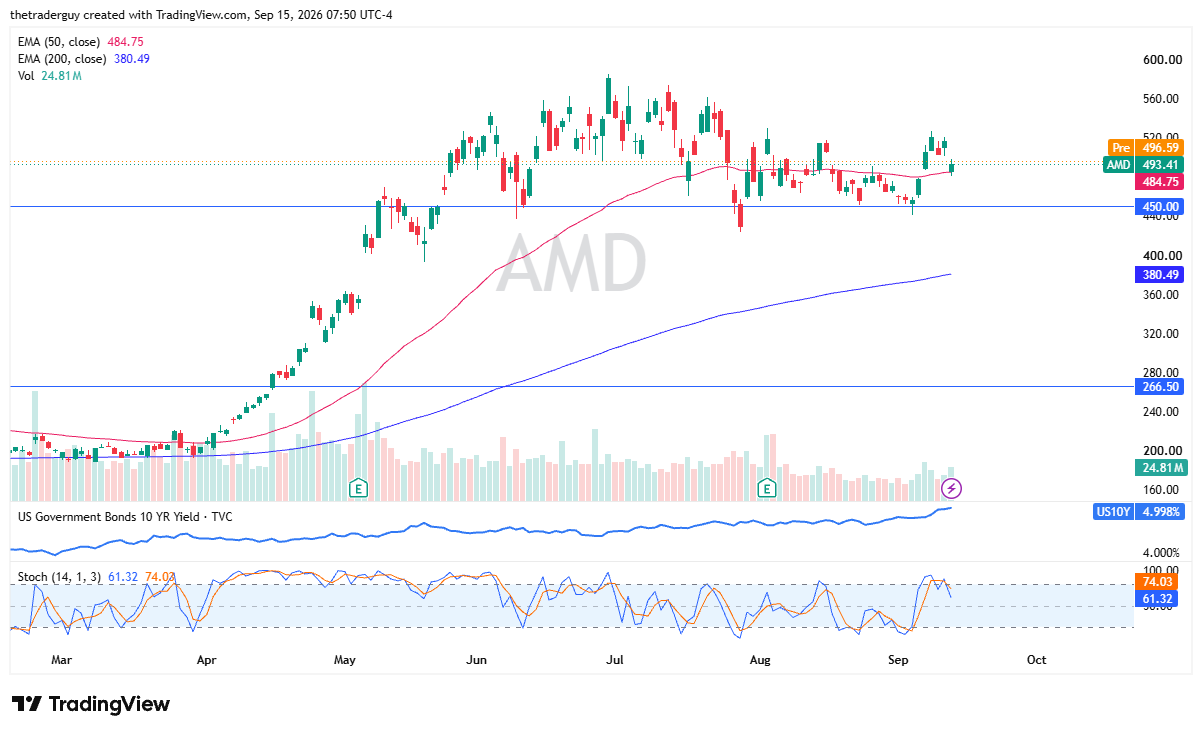
AMD looks slightly positive as well. The same situation applies as with NVIDIA. The question is, will there be less demand for chips? AMD’s company-specific AI story remains exceptionally strong, like NVIDIA’s, and they are expecting the addressable market to be approximately $2 trillion by 2030, so demand should still be out there.
It is increasingly landing major infrastructure deployments rather than simply presenting an alternative to NVIDIA. It is becoming a true competitor. The valuation is a bit high at the moment, but it looks like we are still very much in consolidation, with $450 offering a bit of a floor.
If you’d like to know more about technical analysis and how traders use it, please visit our educational area.