



The New Zealand Dollar spiked lower last week in response to a sharp rise in U.S. Treasury yields. Last Tuesday, the benchmark 10-year U.S. Treasury yield broke through the psychological 3-percent level. The tightening of the spread between U.S. Government Bonds and New Zealand Government Bonds helped make the U.S. Dollar a more attractive investment.
The NZD/USD settled the week at .7084, down 0.0121 or -1.67%.
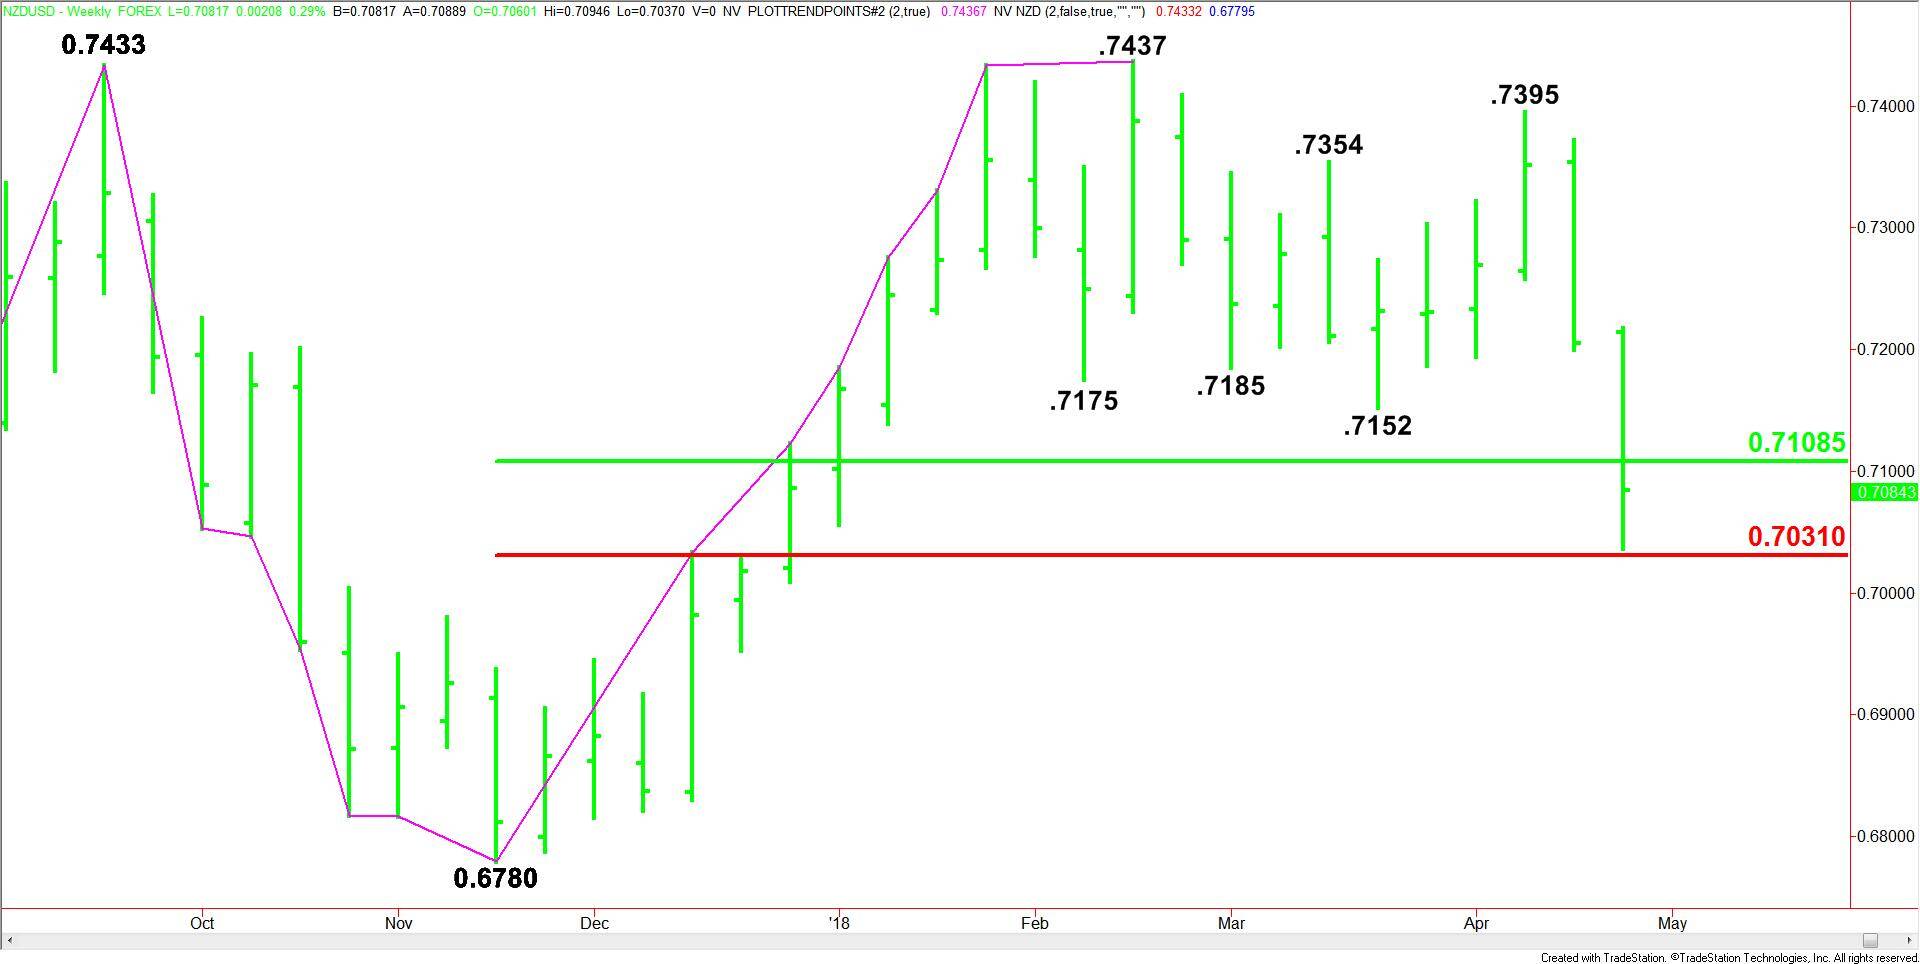
Weekly Swing Chart Technical Analysis
The main trend is up according to the main swing chart, but momentum is trending lower.
The main range is .6780 to .7437. The Kiwi is currently testing its retracement zone at .7109 to .7031.
The minor trend is down. This indicates the shift in momentum to the downside.
Weekly Swing Chart Technical Forecast
Based on last week’s price action and the close at .7084, the direction of the NZD/USD this week is likely to be determined by trader reaction to the 50% level at .7109 and the 61.8% level at .7031.
Overtaking and sustaining a rally over .7109 will signal the presence of aggressive counter-trend buyers. If this generates enough upside momentum, we could see the rally extend as far as .7216 to .7217 over the near-term.
A sustained move under .7031 will indicate the presence of sellers. This could trigger the start of another acceleration to the downside with .6780 the next major downside target.
Holding inside .7109 to .7031 will indicate investor indecision and impending volatility.